

What Is Business Intelligence Reporting Explained
At its most fundamental level, business intelligence reporting is all about turning mountains of raw company data into clear, actionable insights that people can actually use to make smarter decisions.
Think of all the information your business generates—sales figures, customer support tickets, website traffic, operational costs. BI reporting takes that complex, messy data and translates it into easy-to-digest formats like dashboards, charts, and summaries. It’s less about spreadsheets and more about telling a story with your data.
From Raw Data to Strategic Decisions
Imagine trying to drive cross-country using a box of loose, hand-drawn maps of individual towns. You might get somewhere eventually, but it would be chaotic, slow, and full of wrong turns.
That’s what running a business without BI is like. Business intelligence reporting is your GPS. It pulls all that scattered information together onto a single, clear screen, showing you not just where you are, but the best route to get where you want to go. It reveals the connections between different data points so you can chart a confident course forward.
This process fundamentally changes how a company operates, moving it from constantly reacting to problems to proactively anticipating them. Instead of scrambling to figure out why sales dipped last quarter, you can see the trends forming in real-time and adjust your strategy before it becomes a major issue. It’s the difference between asking "What happened?" and understanding "Why did it happen?"
Business intelligence isn't about giving people more data. It's about giving the right people the right data at the right time, so they can make better, more informed decisions. It turns information from a liability into a strategic asset.
This isn't just a nice-to-have anymore. With the amount of data in the world expected to skyrocket to 175 zettabytes by 2025, trying to make sense of it all manually is impossible. BI tools are what make managing and interpreting these massive datasets not just possible, but efficient. You can get a deeper look into market trends with this business intelligence market research.
The Core Purpose of BI Reporting
Ultimately, the goal of BI reporting is to establish a single source of truth for the entire organization.
When every team—from sales and marketing to finance and operations—is working from the same verified data, the endless debates over whose numbers are "right" simply vanish. This alignment is the bedrock of a data-driven culture, where decisions are backed by evidence, not just gut feelings.
BI reporting serves several critical functions that make this possible. Here's a quick breakdown of its primary roles and the impact they have on a business.
Key Functions of Business Intelligence Reporting
| Function | Description | Business Impact |
|---|---|---|
| Data Consolidation | Gathers information from disparate systems like your CRM, ERP, and marketing tools into one central hub. | Creates a unified view of the business, eliminating data silos and inconsistencies. |
| Performance Monitoring | Tracks key performance indicators (KPIs) in real-time, often on interactive dashboards. | Allows teams to instantly see if they are on track to meet goals and make course corrections. |
| Trend Identification | Analyzes historical data to uncover patterns in customer behavior, market shifts, or operational snags. | Enables proactive planning, from predicting future sales to identifying potential churn risks. |
| Strategic Insight | Summarizes complex data into high-level views that help leadership see the big picture. | Informs long-term strategic decisions, resource allocation, and new market opportunities. |
These functions work together to provide a holistic view of the organization's health and performance, ensuring everyone is on the same page.
Who Benefits from This Process
It’s easy to think that BI is just for the C-suite, but modern tools have completely changed the game. Today, BI empowers everyone in the organization.
- A marketing manager can instantly see which campaigns are delivering the best ROI.
- A sales leader can monitor their team's pipeline and quota attainment in real-time.
- An operations director can spot and resolve bottlenecks in the supply chain before they cause delays.
Each person gets a view tailored to what they need to do their job better. This democratization of data means insights aren't trapped at the top. Instead, they flow freely throughout the company, allowing teams at every level to make smarter, data-informed contributions. The applications are incredibly diverse, as seen with Business Intelligence in the insurance sector, where it's used for everything from risk assessment to claims processing.
By arming every team with clear, reliable reports, organizations build a culture of accountability and continuous improvement, where every move is intentional and backed by fact.
The Engine Behind Your Business Insights
How does a pile of messy, raw data turn into a clean, game-changing report? Business intelligence reporting isn't magic; there's a powerful engine working behind the scenes. Getting a handle on this process is key to trusting the insights you see and making decisions with total confidence.
I like to think of it as a farm-to-table journey for your data. It all starts with raw ingredients, goes through a whole lot of prep and storage, and ends with a perfectly plated dish that everyone can dig into. Every single step is essential if you want the final result to be reliable and insightful.
This infographic gives a great visual of that journey from scattered data points to clear business insights.
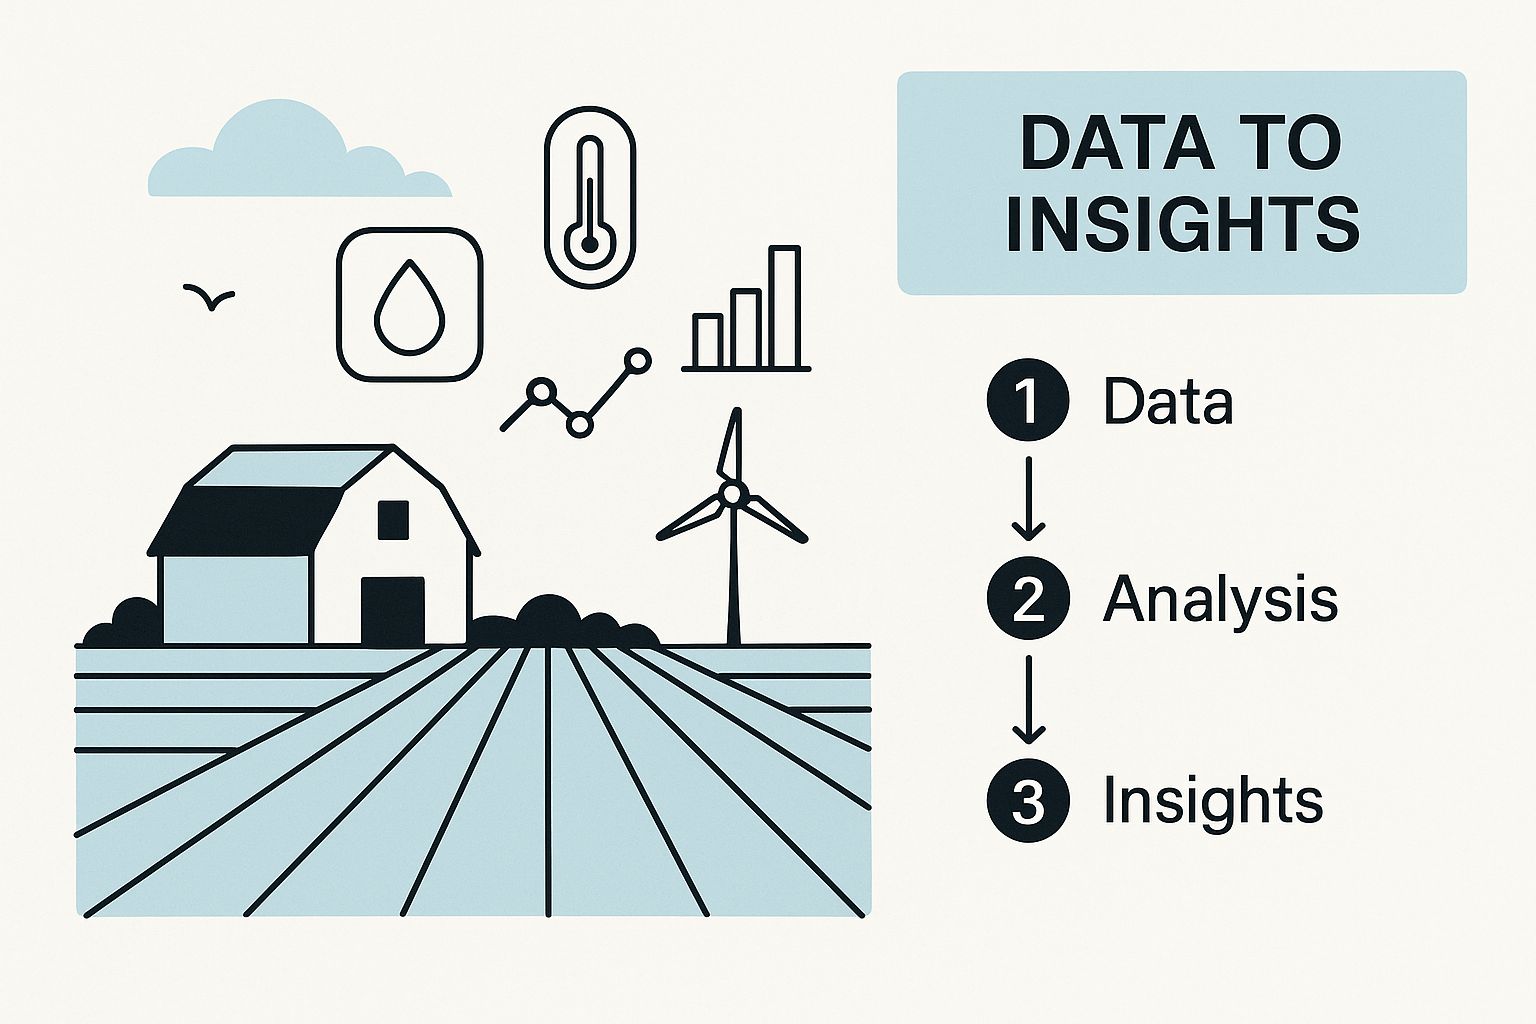
This flow shows how all that foundational data gets systematically processed and refined long before it ever lands on a dashboard, ensuring quality is baked in from the start.
Stage 1: The Data Farm
The whole process kicks off at the source—the "farm" where your data grows. This is just a way of talking about all the different places your company gathers information. These raw ingredients can come from a huge variety of systems.
- Customer Relationship Management (CRM): Think of all your sales team’s notes, deal stages, and customer conversations.
- Enterprise Resource Planning (ERP): This is where your financial data, inventory levels, and supply chain logistics live.
- Marketing Automation Platforms: All the good stuff like email campaign results, ad performance, and website analytics.
- Social Media and Web Analytics: This covers customer sentiment, engagement metrics, and user behavior data.
Just like a chef needs fresh, quality ingredients, your BI reports need good data. At this point, the data is everywhere, but it's often disconnected, inconsistent, and nowhere near ready for analysis.
Stage 2: The Processing Kitchen
Next up, the raw data heads to the "kitchen" for prep work. This critical step is known as the ETL process, which stands for Extract, Transform, and Load. It’s where data gets scrubbed, standardized, and organized so it's actually useful.
- Extract: Data is pulled from all those different sources we just talked about.
- Transform: This is where the real magic happens. The data is cleaned up to get rid of errors, duplicates are tossed out, formats are standardized (like making sure "USA" and "United States" are treated as the same thing), and any necessary calculations are done.
- Load: Finally, the newly cleaned and structured data is loaded into a central repository.
If you skipped this stage, you'd basically be trying to cook with unwashed vegetables and ingredients in mismatched containers—a true recipe for disaster. The ETL process makes sure every piece of information is consistent and reliable.
A BI report is only as trustworthy as the data it's built upon. The ETL process is the quality control that turns messy raw data into a dependable foundation for your business decisions.
This disciplined approach is what stops the classic "garbage in, garbage out" problem from derailing your data initiatives before they even start.
Stage 3: The Data Pantry
Once it’s prepped, the processed data gets stored in the "pantry," which in the tech world is usually a data warehouse or a data mart. This isn't just some storage closet; it’s a highly organized system built for lightning-fast and efficient analysis.
A data warehouse stores historical data from all over the business in a structured way. This lets you see not just what’s happening right now, but also analyze trends over months or even years. That historical context is gold for spotting patterns and making accurate forecasts.
Stage 4: Plating and Serving the Insights
At last, it's time to "plate the dish" and serve up the insights. This is where business intelligence tools enter the picture. These platforms connect to the data warehouse and give you the user-friendly interfaces needed to create reports, dashboards, and visualizations.
This is the stage most people think of when they hear what is business intelligence reporting. The BI tool is like the chef, taking all the prepped ingredients from the pantry and presenting them in a way that's easy on the eyes and even easier to understand. A huge part of making BI work is translating complex data into something you can act on. To really get the most from these reports, especially when it comes to financial health, you have to know how to interpret financial statements.
With dozens of options out there, our business intelligence tools comparison can help you sort through the noise and find the right platform. This final step is what turns all that backend work into real, tangible value for your entire team.
Unlock Your Competitive Advantage with BI Reporting
It’s one thing to understand the mechanics of business intelligence, but it’s another thing entirely to see what it can actually do. BI reporting isn't just about making pretty charts; it's a strategic weapon for unlocking real, bottom-line advantages that can put you miles ahead of the competition. At its core, it’s about making smarter, faster, and more profitable decisions across the board.
This whole process kicks off by establishing a single source of truth. We’ve all been in those meetings, right? Sales has one set of revenue numbers, and finance has another. The result is pure chaos—confusion, mistrust, and an hour wasted just figuring out whose data is right. BI reporting puts an end to that by funneling all your information into one verified, trusted hub. When everyone is reading from the same sheet of music, the entire company pulls in the same direction.

That kind of alignment is the bedrock of an agile business, one that can pivot on a dime based on hard data, not just a hunch.
Accelerate Informed Decision Making
In business, speed is everything. The ability to make a quick, smart call can mean the difference between snagging a huge market opportunity and watching a competitor run away with it. This is where BI reporting really shines. Instead of waiting weeks for someone to manually cobble together a report, your teams get real-time insights right when they need them.
This instant access to information massively shrinks the decision-making cycle. In fact, organizations that fully embrace BI are reportedly five times more likely to make faster and better-informed decisions. You can dig into more business intelligence statistics to see just how profound the effect is. Think about it: a marketing team can tweak ad spend in the middle of a campaign based on live results, or a product manager can prioritize a feature based on what users were doing just minutes ago.
A business without BI is driving by looking in the rearview mirror. Business intelligence reporting provides the windshield view, showing you not just what’s behind you but, more importantly, what’s happening on the road ahead right now.
This proactive approach allows companies to be nimble and strategic, reacting to market shifts in hours or days, not getting bogged down for months.
Uncover Hidden Revenue Opportunities
Your data is a goldmine, full of clues about where your next big win is hiding—you just need the right tools to find them. BI reporting is like a detective for your company, meticulously sifting through mountains of information to spot patterns, trends, and opportunities that would otherwise go completely unnoticed.
These discoveries often lead directly to new revenue streams or major cost savings. For instance, by analyzing customer behavior, a SaaS company might find that users who adopt a certain feature are 40% less likely to churn. Armed with that insight, they can launch a campaign to push that feature to everyone, directly boosting retention and customer lifetime value.
Here are a few common ways BI uncovers that hidden value:
- Product Cross-Selling: An e-commerce business sees that customers who buy product A almost always buy product B within 30 days. They can then set up automated marketing to capitalize on that predictable pattern.
- Inventory Optimization: A retailer uses sales trend data to forecast demand for seasonal products, which helps them avoid getting stuck with costly overstock or, even worse, running out of a bestseller.
- Customer Segmentation: A B2B firm segments its clients by profitability. This allows the sales team to stop treating everyone the same and instead focus their energy on the high-value accounts that matter most.
Each of these examples is a direct line to greater profitability, and spotting them would be next to impossible without the analytical muscle of BI reporting. By digging into your data systematically, you move beyond guesswork and start making moves backed by hard evidence, giving you a serious competitive edge.
How Modern Teams Actually Use BI Reporting
Let's be clear: business intelligence reporting isn't some high-level tool reserved for executives staring at charts in a boardroom. Its real magic happens when it gets into the hands of the teams on the ground—the people making dozens of decisions every single day.
When BI evolves from a quarterly review into a daily operational dashboard, it becomes the pulse of the company. It’s where performance gets measured, strategies get tested, and gut feelings are replaced by hard facts.
So, how does this play out in the real world? Let's look at how different teams turn abstract data into concrete actions that move the needle.

Driving Sales with Predictive Dashboards
For a sales team, BI is less of a rearview mirror and more of a crystal ball for their pipeline. Instead of relying on hunches and messy spreadsheets, sales managers can tap into live dashboards connected directly to their CRM.
Imagine a sales leader pulling up a report that doesn't just show revenue-to-date. It forecasts the probability of closing deals in the pipeline based on past performance. It can instantly flag deals that have stalled in a specific stage or pinpoint reps who might need a bit of coaching on a particular part of the sales cycle.
This is proactive management. For instance, a dashboard might surface that deals involving a new competitor have a 20% lower win rate. The sales leader can immediately organize a training session on competitive positioning, tackling the problem before it tanks the entire quarter. To see what these look like in action, check out these business intelligence dashboard examples.
Optimizing Marketing Spend for Real ROI
Marketing teams are drowning in data. It's coming from social media, email campaigns, paid ads, web analytics—you name it. BI reporting is the thread that ties all these disparate sources together to answer the one question that truly matters: what's actually working?
A marketing manager can use a BI dashboard to move way beyond vanity metrics like clicks and impressions. A well-built report visualizes the entire customer journey, showing which channels are generating the most qualified leads and, crucially, which ones are converting into paying customers.
Business intelligence gives marketers the clarity to stop guessing and start investing. It transforms the marketing budget from an expense into a strategic growth driver by proving which activities deliver the highest return.
This means they can confidently double down on high-performing campaigns and pull the plug on those that are just burning cash. It’s about optimizing every dollar for maximum impact.
Enhancing Product Development and Operations
The power of BI reporting doesn’t stop at sales and marketing. It’s a game-changer for product and operations teams, too, helping them refine strategies and build a more efficient business.
- Product Teams: By digging into user behavior data, product managers can see exactly which features customers love and where they're getting stuck. This insight directly informs the product roadmap, ensuring development time is spent on things that truly matter.
- Operations Managers: An operations team can use BI to monitor supply chain logistics in real-time. They can spot bottlenecks before they become major problems and optimize inventory levels to slash costs without risking stockouts.
- Customer Support: BI dashboards can track support ticket volume, resolution times, and customer satisfaction scores. A sudden spike in tickets related to a new feature launch instantly tells the team they have a problem to solve.
From fine-tuning a feature to streamlining a warehouse, BI reporting provides the objective evidence needed to make smarter adjustments that improve both the customer experience and the company’s bottom line.
BI Reporting Use Cases by Department
To bring it all together, here’s a quick look at how different departments use BI reporting to hit their specific goals.
| Department | Primary Goal | Example BI Report | Key Metrics Tracked |
|---|---|---|---|
| Sales | Increase Revenue & Pipeline Velocity | Sales Performance Dashboard | Win Rate, Deal Size, Sales Cycle Length, Quota Attainment |
| Marketing | Improve ROI & Lead Quality | Campaign Attribution Report | Customer Acquisition Cost (CAC), Lifetime Value (LTV), MQL-to-SQL Conversion Rate |
| Product | Enhance User Engagement & Retention | Feature Adoption Analysis | Daily Active Users (DAU), Churn Rate, User Stickiness, Funnel Conversion |
| Finance | Optimize Profitability & Cash Flow | Financial Health Overview | Gross Margin, Operating Expenses, Burn Rate, Accounts Receivable Days |
| Customer Support | Boost Customer Satisfaction | Support Ticket Trends Report | First Response Time, CSAT Score, Ticket Volume, Resolution Rate |
As you can see, the goals and metrics change from one team to the next, but the underlying principle is the same: using data to make better, faster, and more informed decisions.
The Future of Business Intelligence Reporting
https://www.youtube.com/embed/cVibCHRSxB0
Business intelligence reporting has come a long way. If you’ve been in the game for a while, you remember the old days: rigid, clunky reports that took weeks for the IT department to generate. Today’s flexible, self-service dashboards are a world apart, but we’re on the cusp of another massive leap forward.
The evolution isn’t slowing down; it’s speeding up, with artificial intelligence and machine learning now in the driver's seat. The future of BI isn't just about looking in the rearview mirror to see what happened last quarter. It’s about building smart systems that predict what’s coming next and help you make the right call, fundamentally changing what business intelligence reporting is.
The Rise of Predictive and Augmented Analytics
The next big step is baking predictive power right into the reports you use every day. Think about your sales forecast dashboard. Instead of just showing past performance, imagine it using machine learning to accurately project future revenue based on your current pipeline and historical conversion rates. This is the difference between describing the past and predicting the future.
This is where augmented analytics truly shines. It’s a game-changer. Rather than you having to manually slice and dice data hoping to find a golden nugget, augmented analytics uses AI to push critical insights directly to you.
- Anomaly Detection: Picture the system instantly flagging a sudden drop in user engagement in a key market, letting you investigate before it turns into a real problem.
- Key Driver Analysis: It could automatically identify the top three reasons your sales jumped last month, so you know exactly what to double down on.
- Automated Insights: Instead of just a complex chart, it provides a simple, plain-English summary explaining what the data actually means.
The whole point of augmented analytics is to give every employee an intelligent assistant. It’s always working behind the scenes to uncover the "unknown unknowns"—those crucial insights you weren't even looking for.
This shift frees up your team's time. Less time hunting for data means more time acting on it. It puts the power of a data scientist in the hands of your entire team, regardless of their technical background.
AI Embedded Directly into Business Applications
Looking even further ahead, the boundary between BI platforms and your everyday software is dissolving. AI-driven analytics will become a natural part of the tools your teams already live in, like your CRM or project management system. Your sales reps won't have to switch screens to get an AI-powered recommendation on which lead has the highest chance of closing.
This isn’t some far-off fantasy; it's quickly becoming the new standard. By 2025, an estimated 75% of enterprise applications will have AI features built-in, including sophisticated analytics and decision support. This tight integration makes BI reports more accurate and immediately useful. You can explore more on this and other key business intelligence statistics.
Ultimately, the future of BI is about being smarter, faster, and more intuitive. We're building systems where data doesn't just tell you what happened, but actively guides you toward what to do next. It’s becoming an indispensable partner for any company serious about growth.
Building Your First BI Reporting Strategy
So, you've got a handle on what BI reporting is and what it can do. That’s the easy part. Now comes the real work: creating a strategy that actually delivers results.
Building a BI plan isn’t about chasing the latest, flashiest software. It’s about being deliberate and tying every piece of technology back to a concrete business goal. Think of it like building a house—you wouldn't just start buying bricks and windows without a detailed blueprint. Your BI strategy is that blueprint. It ensures every report and dashboard has a clear purpose and pushes your company forward.
Define Your Business Objectives First
Before you even think about looking at BI tools, stop and ask the most important question: What business problems are we actually trying to solve? Without clear objectives, you're just collecting data for the sake of it, and nobody has time for that.
Start by setting specific, measurable goals. Get granular.
- Are you trying to cut customer churn by 15% in the next six months?
- Do you need to boost marketing campaign ROI by 25% this quarter?
- Is your main goal to shorten the average sales cycle by ten days?
Answering these questions first gives your entire strategy a north star. From there, every decision—from which data sources to connect to how you design a dashboard—should directly support these goals. This laser focus is what separates reports that get used from those that just collect digital dust.
Establish Strong Data Governance
Let's be blunt: a beautiful dashboard built on bad data is completely useless. This is where data governance comes in, and it’s non-negotiable.
Data governance is simply the set of rules and processes that keeps your data accurate, consistent, and secure. It’s the framework that answers critical questions like:
- Who is the official owner of our sales data?
- How do we define an "active customer" across every single department?
- Who gets to see sensitive financial information, and who doesn't?
Without clear rules, you fall into the classic "garbage in, garbage out" trap, which completely erodes trust in your reporting. To really nail this, check out our guide on how to improve data quality. Getting this right is the bedrock of any successful BI project.
Foster a Data-Driven Culture
Ultimately, a BI strategy is less about technology and more about people. Your end game is to create a culture where data is a natural part of everyday work. This means training your teams, encouraging them to ask questions, and celebrating the wins that came from data-backed insights.
A successful BI implementation isn't measured by the number of reports you create, but by the number of informed decisions your team makes. The goal is to make data a natural part of every conversation.
You'll know you've succeeded when your teams instinctively turn to their dashboards to answer questions or challenge assumptions. That’s when you've moved beyond just having reports to truly operating as an intelligent business. Companies that get this right see an average ROI of 112%, often getting their money back in as little as 1.6 years. You can read more about these BI adoption impacts to see just how valuable a well-executed strategy can be.
A Few Common BI Reporting Questions, Answered
Even after getting the basics down, a few specific questions always seem to pop up when teams start digging into business intelligence. Nailing these details is what separates a fuzzy understanding from the kind of confidence you need to actually put BI to work. Let's tackle the most common ones I hear.
What's the Real Difference Between BI Reporting and Data Analytics?
I like to use a simple car analogy for this.
Think of business intelligence reporting as your car's dashboard. It gives you a crystal-clear view of what's happening right now and what just happened. You can see your speed, check your fuel gauge, and see the miles you've already covered. It's all about descriptive analytics—giving you a snapshot of the past and present.
Data analytics, on the other hand, is a much bigger concept. It includes your dashboard, but it's also your GPS system. It uses data to predict a traffic jam up ahead (predictive analytics) and then suggests a better route to get you to your destination on time (prescriptive analytics). BI reporting tells you what is happening; data analytics uses that information to tell you why it's happening and what you should do next.
Who Actually Uses Business Intelligence Reports These Days?
If you asked this question ten years ago, the answer would have been simple: executives and data analysts. That’s it. But today, the game has completely changed. Modern BI platforms are built for just about everyone in a company, from the C-suite to the front lines.
The whole point is to get the right information to the people who can act on it immediately.
- A sales manager can pull up a report to see their team's pipeline in real-time before a weekly check-in.
- A marketer can watch campaign ROI as it happens, shifting budget away from what isn't working.
- A support lead can track ticket resolution times to spot bottlenecks and improve the customer experience.
The goal of modern BI isn't just to inform executives. It's to empower every single employee to make smarter, faster decisions with data that’s directly relevant to their job. It's about pulling insights out of the boardroom and embedding them into day-to-day work.
How Do You Even Start Creating a Useful BI Report?
This might sound counterintuitive, but the most critical first step has absolutely nothing to do with data, charts, or software. You have to start by defining the business question you need an answer to. A report without a clear question is just noise.
Begin with a specific, concrete goal. For instance, "Which of our marketing channels are bringing in the most profitable customers?" Once you have a question that sharp, the path forward clears up instantly. From there, you can identify the key metrics (KPIs) you'll need, figure out where that data lives, and then finally, use a BI tool to build a dashboard that tells the story. Always, always lead with the question, not with the data.
Ready to move beyond questions and start building a more intelligent, automated business? MakeAutomation specializes in creating the efficient operational frameworks that power data-driven decisions. We help B2B and SaaS companies implement the automated systems needed to scale effectively and accelerate growth.
Explore our AI and automation solutions at makeautomation.co