
What Is Sales Velocity and How Does It Drive B2B Growth
Ever heard of sales velocity? It’s a crucial metric that tells you how fast your team is turning leads into actual revenue. Think of it as a speedometer for your sales team—it shows you just how quickly you're moving deals through your pipeline and closing them.
Decoding Your Revenue Speedometer
So, what does that mean in the real world? Sales velocity isn't just another buzzword to throw around in meetings. It's a powerful health check for your entire sales operation. It pulls together four distinct sales metrics to give you a single, clear picture of your revenue-generating power.
Instead of getting bogged down by individual numbers like lead count or close rates, sales velocity combines them. The result is one powerful score that tells you how much revenue you can realistically expect to generate each day, week, or month.
The Four Gears of Your Sales Engine
To really get a grip on sales velocity, you need to understand its four key parts. Picture them as four interlocking gears in your sales machine. If one gear is stuck or moving too slowly, the whole machine sputters.
These four gears are:
- Number of Opportunities (#): This is simply the number of qualified leads your sales team is actively pursuing during a set time. It’s the raw fuel for your engine.
- Average Deal Value ($): This is the typical dollar amount of a single sale. Think of it as the horsepower behind each win.
- Win Rate (%): This is the percentage of your opportunities that actually become paying customers. It’s a direct measure of your sales process's efficiency.
- Sales Cycle Length (Time): This is the average time it takes to get from that first "hello" to a signed contract. It's how long it takes for a deal to cross the finish line.
When you track how these four elements work together, you move past just counting activities and start to truly understand your sales performance.
A low sales velocity isn't just a sign of a slow quarter; it's an early warning system. It points to deeper problems—maybe your leads aren't great, your sales process is too clunky, or your team is struggling to close.
This is what makes the metric so incredibly useful. It helps you find the exact bottleneck that's holding back your growth. For instance, maybe you have a ton of opportunities in the pipeline, but your sales cycle is painfully long. Or maybe your win rate is fantastic, but the small average deal size is capping your revenue potential.
Looking at your performance this way lets you make much smarter, data-backed decisions. You'll know exactly which lever to pull to speed things up—whether that means finding more leads, aiming for bigger deals, closing more effectively, or just shortening the whole sales process. This guide will walk you through exactly how to measure, analyze, and crank up this critical metric.
The Four Levers of the Sales Velocity Formula
Think of your sales process like a high-performance engine. Sales velocity isn't just one single number; it's the output generated by four critical, interconnected parts working together. To truly tune your engine for maximum speed and revenue, you need to understand each component individually.
Each variable in the formula—Opportunities, Average Deal Value, Win Rate, and Sales Cycle Length—is a lever you can pull. Knowing which one to adjust, and when, is the secret to getting your revenue engine humming.
This concept map breaks down how these four levers work in concert to drive your overall sales velocity.
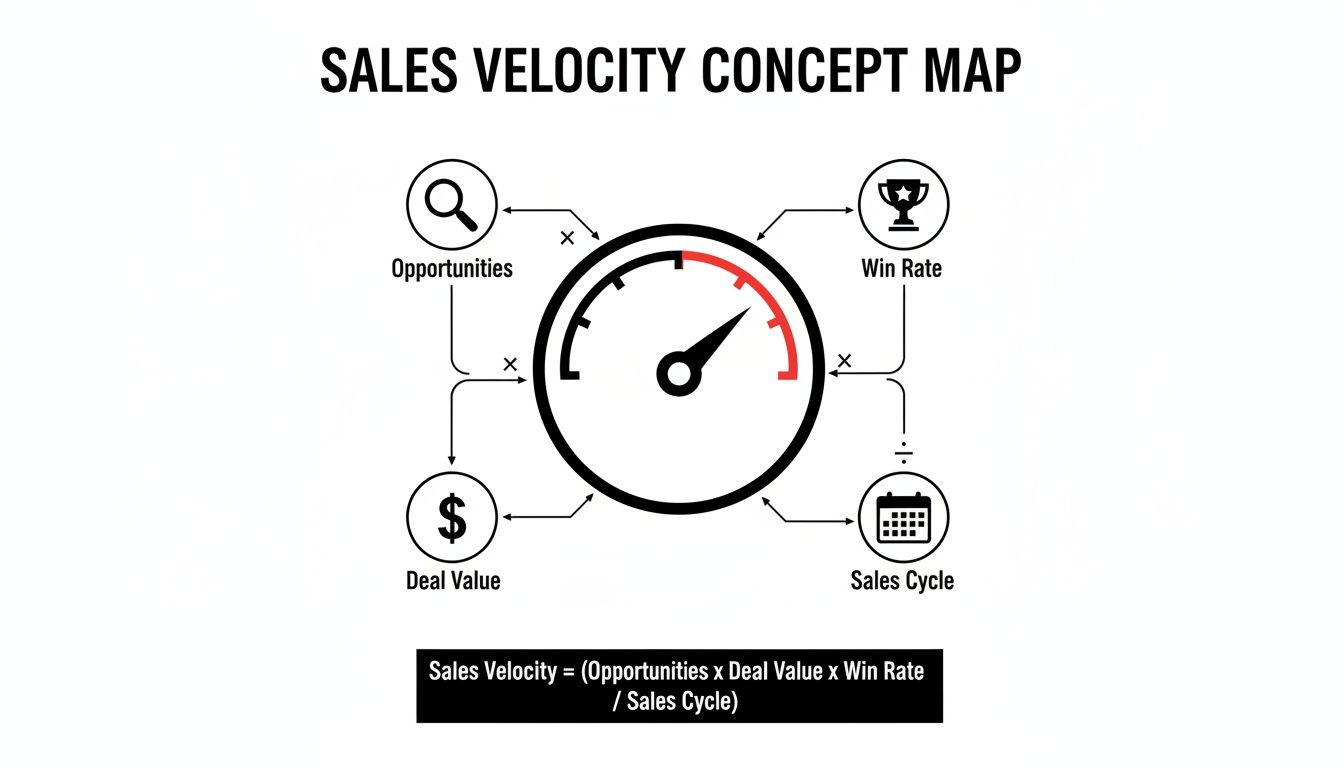
As you can see, they all influence each other. True acceleration isn't about maxing out one lever; it’s about finding the right balance among all four to build unstoppable momentum.
Lever 1: Opportunities
The number of opportunities (#) is the fuel for your sales engine. This is a simple count of the qualified leads sitting in your pipeline during a given period—be it a month or a quarter. It's the raw material for every dollar you hope to earn.
While it’s tempting to chase a higher number, quality is what really matters. A pipeline stuffed with a thousand lukewarm prospects is far less valuable than one with a hundred genuinely interested, well-vetted leads. This is where solid sales pipeline management separates the best from the rest.
Your goal here is to keep the top of your funnel consistently filled with prospects who have a real problem you can solve and the power to make a buying decision.
Lever 2: Average Deal Value
Next up is your Average Deal Value ($). If opportunities are the fuel, think of this as the horsepower. It's the average dollar amount you bring in from each successfully closed deal.
A higher average deal value means every single "yes" has a bigger impact on your bottom line. It lets you hit your revenue targets with fewer wins, which is a massive efficiency gain. This metric is a direct reflection of your pricing, your product-market fit, and how well your team sells on value, not just features.
A small bump in your average deal value can have an outsized impact on your total velocity. For instance, a modest 10% increase in deal size boosts your final velocity score by that same 10%, often without any extra effort from your sales reps.
This is where strategies like upselling, cross-selling, or focusing on more lucrative enterprise clients can make a huge difference.
Lever 3: Win Rate
Your Win Rate (%) is all about efficiency. It’s the percentage of qualified opportunities that your team successfully converts into paying customers. It’s a straightforward calculation: if you close 20 deals out of 100 qualified opportunities, your win rate is 20%.
This number tells you a story about how effective your sales process really is, from the first conversation to the final signature. A low win rate might point to problems with lead qualification, a disconnect in your messaging, or a need for better sales training. On the flip side, a high win rate is a clear sign that your team is firing on all cylinders.
Lever 4: Sales Cycle Length
Finally, we have Sales Cycle Length, the only lever you want to decrease. This metric represents time—specifically, the average number of days it takes for an opportunity to go from an initial lead to a closed deal.
A shorter sales cycle is a game-changer. It means you’re bringing in revenue faster, which improves cash flow and frees up your reps to chase the next deal. Long, drawn-out sales cycles drain resources, increase the odds of a deal going cold, and can kill your team's morale.
This has become a major pain point for many companies lately. In fact, a staggering 81% of businesses reported that their velocity slowed in 2023, largely because economic pressures stretched their sales cycles longer than ever. The key is to find and eliminate the bottlenecks, whether that's a clunky legal review process or time-consuming manual proposals. Shave days or even weeks off your cycle, and you’ll see your velocity soar.
To tie it all together, here’s a quick summary of how these four levers function and how you can start influencing them.
The Four Levers of Sales Velocity
| Metric Component | What It Measures | Business Impact | How to Improve It |
|---|---|---|---|
| Opportunities (#) | The number of qualified leads in your pipeline per period. | The "fuel" for your sales engine; determines potential revenue. | Increase lead generation, refine ICP, improve qualification. |
| Average Deal Value ($) | The average revenue generated from each closed-won deal. | The "horsepower"; a higher value means more revenue per win. | Upsell/cross-sell, focus on high-value segments, bundle products. |
| Win Rate (%) | The percentage of opportunities converted into customers. | A measure of sales process efficiency and effectiveness. | Improve sales training, refine messaging, use better qualification. |
| Sales Cycle Length (Days) | The average time it takes to close a deal. | The "time" factor; shorter cycles mean faster revenue. | Automate tasks, remove bottlenecks, streamline contracts. |
By viewing your sales performance through this four-part framework, you can move from simply measuring results to actively engineering better outcomes. Each lever offers a distinct path to accelerating your growth.
Calculating Sales Velocity with a Real-World Example
Alright, let's move past the theory. The real magic of sales velocity happens when you stop thinking about it as an abstract concept and start plugging in your own numbers. Seeing it in action is what turns this from a neat idea into a powerful tool for forecasting and planning.
![]()
Let's walk through a tangible example. Picture a B2B SaaS company we'll call "Innovate Solutions." They've been diligently tracking their sales metrics for the last quarter and are ready to figure out their velocity.
Setting the Scene at Innovate Solutions
To get their sales velocity, the team at Innovate Solutions pulled the data for the four key variables. Here’s what their last 90 days looked like:
- Number of Opportunities (#): They generated 100 qualified opportunities.
- Average Deal Value ($): Their average new customer contract is worth $10,000.
- Win Rate (%): The sales team successfully closed 20% of those opportunities.
- Sales Cycle Length (Time): On average, it took them 90 days to get a deal from "hello" to "signed."
With these four pieces of the puzzle, we have everything we need to calculate just how quickly Innovate Solutions is turning pipeline into revenue.
Running the Numbers
So, let's plug their data into the formula: (Opportunities x Average Deal Value x Win Rate) / Sales Cycle Length.
Here's how it breaks down for them:
- (100 Opps x $10,000 Deal Value x 0.20 Win Rate) / 90 Days
- ($200,000 Total Pipeline Value) / 90 Days
- Result = $2,222 per day
That simple calculation tells us that Innovate Solutions has a sales velocity of $2,222 per day. This one number is the pulse of their sales engine, showing the rate at which they’re generating revenue right now.
This isn’t just a hypothetical exercise. For SaaS and B2B leaders, this is a daily reality. Think about a regional sales team managing 2,500 qualified leads with an average deal size of $6,500. If they maintain an 18% win rate over a 105-day cycle, their math works out to about $2,757 in daily revenue. That's a real-world figure they can use to make strategic decisions. You can dive into more real-world sales metrics to see how these numbers vary across different industries.
The Power of Small Adjustments
Now, here's where it gets interesting. Let's imagine the team at Innovate Solutions decides to focus on improving just one of those variables. They introduce some new automation to speed up their proposal and contract process, which successfully cuts their average sales cycle from 90 days down to 60 days.
Let's run the calculation again with that one change:
(100 Opps x $10,000 Deal Value x 0.20 Win Rate) / 60-Day Sales Cycle = $3,333 per day
Just like that, by shaving a month off their sales cycle, Innovate Solutions boosted its sales velocity by a massive 50%. This is a perfect example of why this metric is so valuable. You don't need to reinvent the wheel. Making small, focused improvements to any of the four levers can have a huge impact on how fast you grow.
Why Sales Velocity Is Your Most Important Growth Metric
Knowing the sales velocity formula is one thing. Actually understanding its power is a whole different ball game. Too many businesses get fixated on static metrics—how many leads came in last month, what was the total revenue last quarter. Those numbers are fine, but they're just snapshots. They capture a single moment but tell you nothing about your momentum.
Sales velocity, on the other hand, is like watching a video of your sales engine in action. It gives you a dynamic, real-time picture of its health, showing not just what you’re earning, but how fast and how efficiently you're earning it. That change in perspective is what separates the good sales teams from the truly great ones.
Moving Beyond Static Metrics
Relying on vanity metrics is like trying to drive forward while only looking in the rearview mirror. A big spike in new leads feels great, but it doesn't say a thing about their quality or how long they'll sit in your pipeline before (or if) they ever close. Sales velocity forces you to look at the whole picture.
Sales velocity is your business's early warning system. It shifts you from reactive fire-fighting to proactive, strategic adjustments by pinpointing exactly where friction is bogging down your revenue engine.
Instead of getting to the end of the quarter and realizing you missed your target, tracking velocity gives you immediate feedback. It turns the entire sales process from a mysterious black box into a transparent system where you can see the direct results of your actions.
The Strategic Edge for B2B and SaaS
This metric is especially critical for B2B and SaaS companies, where sales cycles are notoriously long and complicated. It delivers three huge strategic advantages that are essential for long-term growth.
- Accurate Revenue Forecasting: Velocity gives you a data-backed prediction of what you can realistically earn per day, week, or month. This leads to much sharper financial planning, smarter budgeting, and more confident hiring decisions.
- Pinpointing Weaknesses: Is a low win rate killing your team's morale? Is a clunky contracting stage dragging out your sales cycle by weeks? Sales velocity immediately flags the weakest link, telling you exactly where to focus your training and resources.
- Smarter Resource Allocation: When you know which levers have the biggest impact, you can invest your team's time and money with confidence. You’ll finally have a clear answer on whether to pump more budget into lead gen, sales coaching, or process automation to get the best bang for your buck.
A Powerful Diagnostic Tool
At the end of the day, tracking sales velocity is about diagnosing problems before they become catastrophes. Think of your sales pipeline like the plumbing in your house. A slow drip might not seem like a big deal at first, but over time it can cause serious damage. Sales velocity helps you find that drip—the bottleneck gumming up the works—so you can fix it long before your revenue foundation starts to crack.
This diagnostic power has a real impact on the bottom line. For example, research from McKinsey shows that SaaS companies that actively work on their velocity components see a 10-15% lift in annual contract value (ACV) compared to competitors who don't. You can dig deeper into the key metrics for SaaS growth to see how this all connects.
By obsessing over this one powerful metric, you can finally stop guessing and start engineering your growth. You get the clarity you need to build a more predictable, scalable, and profitable sales machine.
Actionable Strategies to Increase Your Sales Velocity

Knowing your sales velocity is one thing, but actually making it faster is where the magic happens. Real growth comes from systematically improving each of the four key ingredients: the number of opportunities, how much each deal is worth, your win rate, and how long it takes to close.
Think of it like tuning an engine. By making small, targeted adjustments to each component, you can create a powerful compound effect that dramatically accelerates your revenue growth. Let’s dive into some practical, real-world tactics for each lever.
Generate More High-Quality Opportunities
More leads isn't always the answer. The goal is to fill the top of your funnel with the right kind of prospects—the ones who are actually a great fit for what you sell. Quality beats quantity every single time because it means your sales team isn't wasting energy on dead ends.
-
Nail Down Your Ideal Customer Profile (ICP): Get razor-sharp on who you're targeting. Look at your best, happiest customers and find the common threads—what industry are they in? What’s their company size? What specific problems were they trying to solve? A well-defined ICP is the foundation for all your sales and marketing efforts.
-
Let AI Find Your Best-Fit Leads: Modern AI tools can act like a scout for your team, constantly scanning the market for companies that match your ICP and are showing signs they're ready to buy. These platforms can flag prospects who are actively researching solutions like yours, handing your reps a steady stream of warm, qualified leads.
-
Build a Referral Engine: Your current customers can be your most powerful sales channel. Set up a simple, structured referral program that rewards them for making introductions. It's one of the most cost-effective ways to get high-quality leads that already trust you.
Boost Your Average Deal Value
Every deal you close should make the biggest possible impact on your bottom line. When you increase your average deal size, you can hit your revenue goals with fewer sales, which makes your entire team more efficient.
Increasing your average deal value is often the quickest path to a higher sales velocity. A 15% bump in deal size directly leads to a 15% increase in your velocity score, as long as the other factors stay the same.
Here are a couple of solid ways to make that happen:
- Offer Tiered, Value-Based Pricing: Instead of one-size-fits-all pricing, create tiers that align with the value a customer gets. This naturally guides larger, more complex customers toward higher-priced plans that offer the features and support they need.
- Master the Art of Upselling and Cross-selling: Train your reps to spot opportunities to sell premium versions (upselling) or add-on products (cross-selling). The key is to do this by genuinely understanding a customer's goals and showing them how a slightly larger investment can solve an even bigger problem.
Improve Your Win Rate
Your win rate is a direct measure of how effective your sales process is. A rising win rate shows you’re getting better at guiding qualified prospects from initial interest to a signed contract.
This is where ruthless qualification becomes your secret weapon. By focusing your team’s time and energy only on deals with a high probability of closing, you’ll see your win rate—and team morale—skyrocket. An easy way to get started is by implementing a ranking system for your prospects. To dig deeper, check out our guide on https://makeautomation.co/what-is-lead-scoring/, which breaks down how to score leads effectively.
Two other powerful tactics include:
- Standardize Your Sales Playbook: Document a clear, step-by-step sales process that every single rep follows. This creates consistency for your customers and makes it easy to pinpoint what’s working so you can replicate it across the team.
- Automate Your Follow-Ups: Use your CRM to automatically send follow-up emails and reminders. This simple step ensures promising leads don't fall through the cracks and keeps your solution top-of-mind without any manual effort.
Shorten Your Sales Cycle Length
In sales, time kills all deals. The longer a prospect sits in your pipeline, the greater the risk they'll lose interest, find a competitor, or have their budget reallocated. Shrinking your sales cycle gets cash in the door faster and frees up your reps to chase the next opportunity.
- Find and Fix Your Bottlenecks: Map out your sales process from start to finish and look for the stages where deals always seem to get stuck. Common culprits are slow proposal generation, legal reviews that drag on, or messy contract negotiations. Once you find them, fix them.
- Lean on CRM Automation: Get rid of the busywork. Automate repetitive tasks like data entry, scheduling meetings, and running reports. This gives your reps back precious hours they can spend on what they do best: talking to customers and closing deals.
- Use Modern Sales Tools: Smart tech can give you a serious edge. For instance, it’s worth exploring how chatbots can significantly boost sales and revenue. Tools like these can engage website visitors 24/7, answer basic questions instantly, and even qualify leads before a human ever has to get involved.
How to Measure and Report on Sales Velocity Effectively
Knowing what sales velocity is and actually using it are two different things. A metric is just a number until you build a system to track it, understand it, and make decisions based on it. The real goal here is to create a repeatable process that gives you a clear, honest look at the health of your sales engine.
It all starts and ends with your customer relationship management (CRM) platform. Your CRM is the source of truth for all four pieces of the sales velocity puzzle, so your data has to be clean. If the data going in is garbage, the sales velocity number coming out will be just as useless.
Get Your CRM in Order First
Before you can calculate anything meaningful, you have to get your hands dirty and configure your CRM to track the right things consistently. Messy data is the most common reason these initiatives fail, but a little upfront work on data hygiene goes a long way.
Start by getting your whole team on the same page with a few key standards:
- Clearly Defined Deal Stages: Every single person on the sales team needs to use the exact same pipeline stages. This is non-negotiable for accurately measuring your sales cycle length.
- Mandatory Data Fields: Lock it down. Make fields like "deal value" and "estimated close date" required before a deal can be moved to the next stage. No more guesswork.
- Consistent Opportunity Creation: What makes a lead a real, qualified opportunity? Define it, document it, and enforce it. This stops reps from padding the pipeline with fluff and keeps your opportunity count accurate.
This foundational work is what makes the numbers you pull from your CRM trustworthy. Keeping the CRM clean and the data flowing is often a core duty of a strong ops team. To get a better sense of who owns this, check out our guide on what is sales operations and how they drive this kind of efficiency.
Build a Sales Velocity Dashboard You'll Actually Use
Once your data is reliable, you need to make it visible. A simple dashboard is the perfect way to keep an eye on your sales velocity and its component parts over time. You don't need anything fancy; most modern CRMs let you build this in just a few clicks.
Your dashboard should track five critical metrics:
- Overall Sales Velocity Score: This is your headline number. Put it front and center (e.g., $1,500/day).
- Number of Opportunities (Trended): Are you adding enough to the pipeline each week or month?
- Average Deal Value (Trended): Are you landing bigger, better deals over time?
- Win Rate (Trended): How efficient are you at closing the deals you have?
- Average Sales Cycle Length (Trended): Is it taking longer or shorter to get deals across the finish line?
By visualizing not just the final score but also the four levers that move it, you can spot problems instantly. If velocity drops, a quick look at the dashboard will tell you exactly why—maybe you had a drop in new opportunities, or your win rate took a hit last month.
Find Your Reporting Rhythm
Data is just noise until you talk about it. To turn these measurements into real action, you need a consistent reporting cadence that gets the right information to the right people.
A solid reporting rhythm could look something like this:
- Weekly Sales Team Huddles: Pull up the dashboard and look at the four core metrics. This is the time for tactical coaching. Are certain deals getting stuck? Let's talk about how to shorten that sales cycle this week.
- Monthly Leadership Reviews: Show leadership the trended sales velocity score. Use this single metric to tell a story about the business, justify requests for more resources, and make your revenue forecasts way more accurate.
This approach turns reporting from a chore into a strategic conversation. It gives your reps immediate feedback they can act on and provides leadership with the 30,000-foot view they need to guide the company toward faster, more predictable growth.
Answering Your Top Sales Velocity Questions
Even after you've got the formula down, putting sales velocity into practice always brings up a few tricky questions. Let's tackle some of the most common ones you'll run into as you get started.
What’s a Good Sales Velocity Benchmark?
This is the big question, but the honest answer is: there's no universal magic number. A "good" sales velocity is completely relative to your business. Think about it—a company selling a $500/month SaaS tool will naturally have a much different velocity than one closing $50,000 enterprise deals.
The only benchmark that truly matters is your own. The first step is to calculate your current velocity, warts and all. That number becomes your baseline. From there, your goal is simple: make it go up. A steady, upward trend is the real sign of a healthy sales engine.
How Can I Start Tracking If My CRM Data Is a Mess?
Messy CRM data is the bane of almost every sales leader's existence, but don't let it paralyze you. The trick is to avoid boiling the ocean. Don't try to clean up everything at once.
Instead, start small. Pick one manageable slice of your pipeline—maybe a single product line or just one sales team's deals. Commit to cleaning up the data only for that segment.
To do this, enforce a few non-negotiable rules for that group:
- Make sure everyone uses the same deal stages, every time.
- Require deal values and estimated close dates on every new opportunity.
- Get crystal clear on the definition of a qualified opportunity.
This approach gives you a reliable starting point for your calculation and instantly shows you where to focus your broader data cleanup efforts next.
Which of the Four Levers Should I Focus on First?
This is all about finding your biggest bottleneck. Where is your revenue engine springing the biggest leak? A quick look at the four components will usually tell you where to start.
Is your pipeline packed with opportunities, but your win rate is stuck in the mud? Your first move should be to improve lead qualification and sales training. On the flip side, if your win rate is solid but deals crawl along for months, you need to attack your sales cycle length with better automation and process tweaks.
By diagnosing the weakest link first, you ensure your effort goes exactly where it will have the biggest and fastest impact on your overall sales velocity.
Pushing your B2B growth into a higher gear starts with a smart, automated sales process. MakeAutomation specializes in building the systems that cut out the manual grind, freeing up your team to close deals faster. Discover how our automation solutions can boost your sales velocity.