Data Analytics for Small Business Growth
Let's be real for a moment. The term "data analytics" can sound overly corporate and complicated, like something only giant tech companies with endless budgets can afford to care about. But it's not.
At its core, data analytics for a small business is just about using the information you already have—from sales receipts to website clicks—to answer basic questions and make smarter calls. It’s about turning the data you collect every day into a real, tangible advantage.
Why Data Is Your Most Untapped Asset

Forget the intimidating jargon for a second and think about it this way: what if you could find clear, simple answers to your most pressing business questions?
Take a local coffee shop, for example. The owner keeps seeing a frustratingly long line snake out the door between 8 AM and 9 AM. Instead of guessing, she dives into her point-of-sale (POS) system's reports. She discovers that a staggering 70% of morning rush customers order one of the same three drinks.
Armed with that single piece of information, she adds an extra barista just for that peak hour. The result? Wait times are cut in half, and customers are happier. That's data analytics in action. No complex algorithms, just a practical solution to a real problem.
Small Wins Lead to Big Growth
This same thinking works for any small business. Imagine a small e-commerce brand that's losing sales at the last minute. They dig into their abandoned cart data and spot a clear pattern: most people bail when they hit the shipping information page. So, they try one simple change—adding a guest checkout option. Almost overnight, they see a 15% jump in completed sales.
These aren't far-fetched scenarios. They're about using accessible information to make smart, profitable decisions. The good news is that the tools for this are no longer out of reach. Analytics platforms have become much more user-friendly and affordable, letting small businesses tap into their customer and operational data like never before.
Industry experts have seen how AI-powered analysis helps small companies optimize staff schedules, slash waste, and allocate resources more effectively, all by looking at performance and consumer data.
The goal isn’t to become a data scientist. The goal is to get better at running your business by asking the right questions and letting your data provide the answers.
Data analytics isn't just a "nice-to-have"; it's a critical part of a solid business strategy. In fact, getting a handle on your numbers is a key step in the bigger picture of digital transformation for small business. By starting with the data you already have, you can uncover insights that lead directly to smarter marketing, smoother operations, and real, sustainable growth.
Identifying the Metrics That Actually Matter

Jumping into data analytics can feel like trying to drink from a fire hose. Faced with endless charts, graphs, and numbers, it's easy to get lost tracking everything—and understanding nothing. The secret to making data work for your small business isn't about collecting more of it; it's about focusing on the right data.
Instead of getting bogged down in vanity metrics like social media likes, you have to start with your core business goals. What are you actually trying to achieve? Increase profitability? Boost customer loyalty? Your goals are what determine which numbers truly matter, turning a confusing mess of data into a clear roadmap.
Think about a subscription box service trying to grow. New sign-ups are great, but their most critical metric is actually the customer churn rate—the percentage of subscribers who cancel. A high churn rate signals a leaky bucket; they're losing customers as fast as they gain them, which is a recipe for disaster.
Matching Business Goals to Key Metrics
To figure out which numbers to watch, you need a clear line of sight from your big-picture goals to the specific data points that measure your progress. The table below can help you translate those broad objectives into tangible metrics you can actually track.
| Business Goal | Example Key Metric (KPI) | Where to Find This Data | What This Data Tells You |
|---|---|---|---|
| Increase Profitability | Profit Margin per Product/Service | Accounting Software (e.g., QuickBooks, Xero) | Which offerings are your true money-makers and which might be costing you. |
| Boost Customer Retention | Customer Churn Rate | CRM or Subscription Management Software | How well you're keeping existing customers happy and engaged over time. |
| Improve Website Performance | Conversion Rate | Web Analytics (e.g., Google Analytics) | The percentage of website visitors who take a desired action (like making a purchase). |
| Generate More Qualified Leads | Cost Per Lead (CPL) | Ad Platforms (e.g., Google Ads, Facebook Ads) | How much you're spending to acquire a single potential customer from your marketing campaigns. |
| Grow Email Engagement | Click-Through Rate (CTR) | Email Marketing Platform (e.g., Mailchimp) | Whether your email content is compelling enough to make subscribers take the next step. |
This isn't an exhaustive list, but it shows how you can move from a vague idea like "grow the business" to a specific, measurable metric like Conversion Rate.
Connecting Goals to Measurable KPIs
Every business has its own vital signs. A local plumber running Google Ads isn’t just interested in website clicks; their survival depends on the cost per lead. If they spend $500 on ads and only get one phone call, their strategy is failing, no matter how many people visited their site.
The most powerful metrics are those that directly reflect the health of your business. They tell you a story about what’s working, what isn’t, and where your biggest opportunities are hiding.
The great news is that you probably already have this information. You don't need a sophisticated new system to get started. This critical data lives in the tools you use every day:
- Financial Health: Your accounting software like QuickBooks or Xero can reveal profit margins.
- Customer Behavior: Google Analytics shows your website's conversion rate and top-performing pages.
- Marketing Performance: Your email platform tracks open rates and click-through rates for campaigns.
To tie it all together, start by creating a simple dashboard—even a basic spreadsheet works. The goal is to bring your most important numbers into one view, allowing you to spot trends and make connections. This is how raw data becomes real insight.
Tracking just three to five of these Key Performance Indicators (KPIs) consistently is far more powerful than glancing at fifty different metrics once a month. This focus is what separates businesses that use data from businesses that are drowned by it.
Choosing the Right Analytics Tools on a Budget
The market for data analytics tools is crowded and, frankly, overwhelming. It's easy to get drawn in by flashy features and end up paying for a system that’s way more complicated than you need. My advice? Start simple. The goal isn't to buy the most powerful tool; it's to find the one that gives you clear answers to your most important questions.
For most small businesses, the best tools are the ones you already have access to, and they're often free. Think of these as your ground floor for data-driven growth.
Start with the Free Essentials
You can learn an incredible amount about your business without ever pulling out a credit card. Before you even think about paid software, you need to be squeezing every drop of value from these free platforms:
- Google Analytics: This is non-negotiable. If you have a website, you need this. It’s your window into who’s visiting, where they're coming from, and what they’re doing once they get there.
- Built-in Social Media Insights: Don't just post and ghost. Platforms like Facebook, Instagram, and LinkedIn have robust analytics dashboards that break down your audience demographics, post engagement, and follower growth.
- Point-of-Sale (POS) System Reports: If you have a physical store or service business, your POS system is a goldmine. Tools like Square or Shopify track sales trends, top-selling items, and your busiest hours.
These free tools are more than enough to track the core metrics that actually matter. It's all about connecting your main business goals to the right starting metrics.
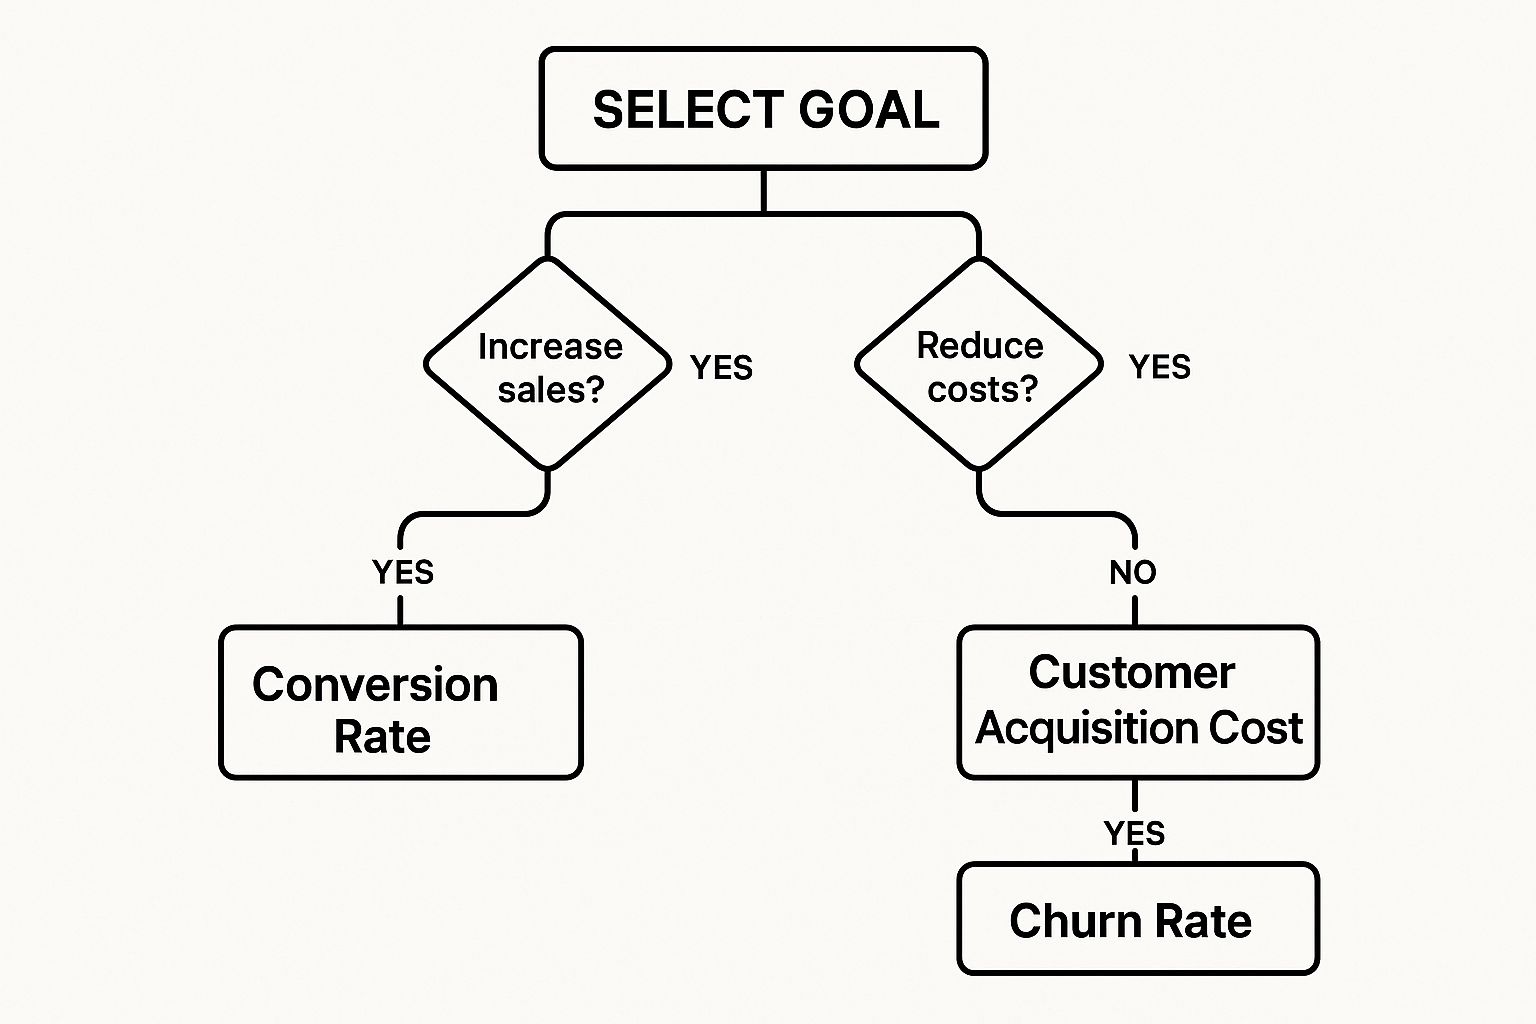
As you can see, if your goal is to boost sales, you should be laser-focused on your conversion rate. If you're trying to cut costs, you need to know your customer acquisition cost. It’s about simplifying, not overcomplicating.
When to Consider Affordable Paid Tools
After a while, you might get tired of hopping between Google Analytics, your social media accounts, and your sales reports. When that happens, it’s time to look at an affordable all-in-one platform.
These tools are built for business owners, not data scientists. They’re designed to pull all that scattered information into one clean, easy-to-understand dashboard, giving you a single source of truth. The right tool really just depends on what kind of business you run. A local coffee shop might get everything it needs from its Square POS data, while an e-commerce store will live and breathe its website analytics to track customer journeys.
The best tool for your business is the one you will actually use. Start simple, focus on one or two key features you need, and leverage free trials to avoid overpaying for features you'll never touch.
Bringing all your data into a central hub is a game-changer. If you want to see what this looks like in practice, check out some of these business intelligence dashboard examples for inspiration. Seeing how others organize their key metrics can spark ideas for how to tell a clear, compelling story with your own numbers.
How to Turn Raw Data Into Actionable Insights

Collecting data is one thing; actually using it is another game entirely. The real magic happens when you learn to listen to what your numbers are telling you. It's about turning a cold, hard spreadsheet into a story that points you toward your next smart business move.
Think of it like being a detective. Your data is full of clues. Your job is to follow the trail, ask the right questions, and piece together the full picture. This isn't about being a math whiz; it's about being curious and connecting the dots.
Let’s imagine a common scenario for a small e-commerce shop. You notice that last month's sales took an unexpected nosedive. Instead of panicking, you pull up two simple data sets: your ad spend from your marketing platforms and your website traffic from Google Analytics.
From Numbers to Narrative
With these two sources in front of you, you can start asking pointed questions. Did we pull back on the ad budget last month? Did a successful campaign wrap up? A quick glance at your traffic data might reveal that while overall visitors dropped, the traffic from your email newsletter actually ticked up.
Suddenly, things start to make sense. The sales dip wasn't just a random event—it correlates directly with a drop in ad spend. At the same time, you've discovered that your email list is a surprisingly resilient source of traffic.
Actionable Insight: Over-relying on paid ads makes your sales volatile. The strong performance of email marketing is a clear signal to invest more in that channel for more stable, predictable revenue.
This is the heart of data analytics for small business. It's less about finding a single "correct answer" and more about understanding the relationships between different parts of your operation. To do this effectively, you need to get all your information in one place. Bringing everything together is a crucial first step, and these data integration best practices are a great starting point for creating that unified view.
Segmenting Your Way to Clarity
Another incredibly powerful technique is customer segmentation. Instead of looking at your customers as one giant, faceless blob, you can slice your data into smaller, more meaningful groups. This is where you often spot the patterns that were invisible before.
Using your sales data, you could create segments based on things like:
- Purchase Frequency: Who are your one-time buyers compared to your die-hard repeat customers?
- Average Order Value (AOV): Who are the big spenders versus the bargain hunters?
- Geographic Location: Are customers in certain cities or states more profitable?
What if you find that 20% of your customers are driving 80% of your revenue? That’s a classic business principle, but seeing it laid out in your own data is a lightbulb moment. Now you know exactly who your VIPs are. You can create targeted campaigns just for them, launch a loyalty program, or even reach out personally to get their feedback.
The good news is that AI is making this kind of analysis more accessible than ever. A 2025 Goldman Sachs survey found that 68% of small business owners are now using AI, a huge leap from 51% just two years ago. This trend is fundamentally changing how small teams work.
By learning to apply more advanced techniques, you can start turning historical data into a forecast for the future. Digging into predictive analytics for marketing can help you get ahead of customer behavior and make proactive decisions, moving you from simply reacting to last month's numbers to actively shaping next month's success.
Turning Your Insights Into Real Business Growth
An insight is just a piece of trivia until you do something with it. This is where the magic happens—where your analysis stops being a report and starts becoming a real growth engine for your business. It's all about closing the loop and making that newfound knowledge actually work for you.
I once worked with a local bakery that took a hard look at their customer feedback surveys alongside their sales data. They kept seeing the same request pop up: more gluten-free options. Instead of shrugging it off, they tested a small, dedicated gluten-free line. Fast forward to today, and that single, data-backed decision now accounts for a whopping 30% of their total revenue.
That’s the power of taking action. It turns analytics from a one-off task into a cycle of continuous improvement.
Building Your Action Plan
So, how do you bridge the gap between spotting a trend and actually cashing in on it? You need an action plan. Don't worry, this doesn't have to be some complex, 50-page document. In my experience, the simplest frameworks are the most effective. The goal is just to create a clear, documented path from insight to outcome.
A great way to start is by framing your insight as a simple hypothesis you can test.
- Insight: "Wow, our website data shows 70% of visitors are ditching their carts right when they see the shipping costs."
- Hypothesis: "I bet if we offered a simple flat-rate shipping option, we could lower that cart abandonment number and boost our sales."
See? Now you have something concrete to work with. From that hypothesis, you can map out a straightforward plan.
- Define the Change: We're going to implement a $5 flat-rate shipping option on the checkout page.
- Set a Measurable Goal: Let's aim to cut the cart abandonment rate by 15% in the first 30 days.
- Assign Ownership: Our e-commerce manager will own this—from getting it live to tracking the results.
- Establish a Timeline: The change goes live on the 1st of the month, and we'll review the results on the 30th.
This simple structure immediately creates accountability and gives you a clear benchmark for what success looks like.
An insight without a corresponding action is just a wasted opportunity. The small businesses that really take off are the ones that build a habit of testing their data-driven hypotheses, learning from what happens, and doing it all over again.
This operational rhythm is getting easier and easier to manage with modern tools. The adoption of AI technologies has exploded; in fact, 96% of small business owners are planning to adopt emerging tech like AI. These tools don't just help with the analysis part; many can help you execute and track the outcomes of your decisions, too.
What's really interesting is that 82% of small businesses using AI have actually increased their workforce, proving that this tech is a powerful partner for expansion, not a replacement for people. You can find more fascinating stats on this from the U.S. Chamber of Commerce report on AI adoption.
This cycle—analyze, hypothesize, act, and measure—is the true heartbeat of a data-driven business. It’s how an online consultant uses website behavior data to redesign a services page and ends up doubling their qualified leads. Each insight becomes a small experiment, and each successful experiment becomes a permanent improvement, steadily compounding your business's growth over time.
Your Top Questions About Small Business Data Analytics, Answered
Jumping into data analytics can feel a bit intimidating, and it's natural to have a few questions. Most of the time, the hurdles you're picturing are much smaller than you think. Let's tackle some of the most common worries that keep business owners from getting started.
The whole point here is to pull back the curtain and show you that using your data is way more about being curious than being a technical genius. You already have what you need to start making smarter moves.
How Much Is This Really Going to Cost Me?
Honestly? You can get started for $0. The smartest way to begin is by using the free analytics tools you probably already have. I'm talking about Google Analytics for your website, the built-in insights on your social media accounts, and the reports from your email marketing platform.
The trick is to start with a specific question you want to answer, not with a shopping list for expensive software. Down the road, as you get more ambitious, you might look at tools that cost $20 to $50 per month. But never, ever pay for a bunch of features you aren't actually going to use.
Do I Need to Go Hire a Data Scientist?
Absolutely not. This is probably the biggest myth out there. Today's analytics tools are designed for business owners and marketers, not data engineers. They use simple visual dashboards and plain English to show you what's going on.
If you can understand a basic bar chart, you have all the technical skill you need to find real gold in your data. The most valuable skill isn't coding—it's genuine curiosity about what makes your business work.
For 99% of small businesses, bringing on a dedicated data expert is completely unnecessary. Just pick one area to focus on first, like where your website traffic comes from, and get comfortable with it. You can always expand from there.
What's the Single Best Metric to Track First?
Every business is unique, but if I had to recommend one starting point, it would be Customer Lifetime Value (CLV). This metric tells you the total profit you can expect from the average customer over the entire time they do business with you.
Why is it so powerful? Because focusing on CLV makes you think about the whole picture. It's not just about one-off sales; it's about attracting the right customers and then keeping them happy so they stick around. This single number helps you make smarter choices about everything from your marketing budget to your customer service, pushing your focus from short-term gains to long-term, sustainable growth.
How Can I Handle Customer Data Safely and Ethically?
This is non-negotiable. Trust is your most valuable asset. The key is to be completely transparent with your customers about what data you're collecting and, just as importantly, why you're collecting it. Stick with reputable software platforms that have strong security built right in.
When you're looking at trends, always anonymize the data by stripping out personal details like names and emails. And yes, it’s worth taking a little time to get familiar with privacy laws like GDPR or CCPA if they apply to your customers. Handling data responsibly isn't just a legal checkbox—it's a massive competitive advantage.
Ready to stop guessing and start making decisions backed by data? MakeAutomation specializes in setting up the AI and automation systems that turn raw numbers into real growth. We’ll help you build efficient, scalable processes so you can get your time back and see a real return on your investment. Learn how we can optimize your business operations.