

What Is Data Driven Decision Making? A Practical Guide
Data-driven decision making (DDDM) is really just what it sounds like: making smart choices based on actual data, not just a gut feeling. It’s a methodical way of letting the evidence guide your business strategy, rather than relying only on past experience or intuition.
Going Beyond Gut Instincts with Data

Think of it like a seasoned ship captain navigating tricky waters. The best captain doesn't just "feel" their way through the fog. They use detailed charts, weather forecasts, and sonar readings to plot the safest, most efficient course. That’s exactly what data-driven decision making does for your business—it's your modern-day navigational toolkit.
This whole process is about collecting the right information, finding the patterns hiding within it, and then using those insights to make solid, defensible choices. It represents a real cultural shift away from decisions made on anecdotes or personal bias toward a commitment to finding objective proof.
The Growing Importance of Data
Embracing a data-first mindset isn't just a trend anymore; it's quickly becoming a fundamental part of running a successful business. We're seeing a huge shift in how companies operate, with 44% of organizations now making most of their decisions based on data.
And it’s not slowing down. Experts predict that by 2025, a staggering 90% of enterprise businesses will consider data essential to their core strategy. That’s a massive indicator of where things are headed.
This isn’t just about crunching numbers for the sake of it. It’s about building a solid foundation of confidence and clarity in every single move your business makes. When your teams are guided by data, they can:
- Validate Assumptions: Put long-held beliefs to the test against what’s actually happening.
- Identify Opportunities: Uncover hidden market trends or spot customer needs you never knew existed.
- Mitigate Risks: Sleep better at night knowing your choices are backed by evidence, not guesswork.
- Measure Impact: Finally get a clear picture of what’s working and what’s not.
To give you a clearer picture, let's compare the old way of doing things with the new.
Intuition-Based vs Data-Driven Decisions
This table breaks down the fundamental differences between leaning on instinct versus leaning on evidence.
| Aspect | Intuition-Based Approach | Data-Driven Approach |
|---|---|---|
| Foundation | Relies on gut feelings, personal experience, and anecdotes. | Grounded in hard data, metrics, and statistical analysis. |
| Process | Often quick, informal, and subjective. | Systematic, methodical, and objective. |
| Justification | "It feels right," or "This is how we've always done it." | "The data shows that…" or "Metrics indicate this trend." |
| Risk Factor | High potential for personal bias and costly errors. | Lower risk, as decisions are based on verifiable evidence. |
| Scalability | Difficult to replicate or teach; depends on the individual. | Easily scalable and can be standardized across teams. |
Moving from the left column to the right is the core of building a modern, resilient business. It’s about being deliberate and intentional.
To truly move beyond subjective feelings, it's essential to quantify your market presence. This means replacing "I think our brand is well-known" with concrete figures that show exactly where you stand.
A perfect example of this is learning how to calculate Share of Voice. Instead of just guessing about your market position, you use real data to measure it precisely. You turn a vague feeling into a hard number you can act on. This transition from instinct to insight is what DDDM is all about.
The Pillars of a Strong Data-Driven Culture

It’s a common mistake to think that buying the latest analytics software is all it takes to become data-driven. But a genuine shift toward data-driven decision making isn't about technology alone—it’s about building a solid foundation from the ground up.
Think of it like a three-legged stool. For the whole thing to be stable, each leg has to be strong and work with the others. If one is shaky, the entire structure is useless. Real change happens when you invest in all three pillars at once.
Accessible and Trustworthy Data
The first and most fundamental pillar is your data. It’s simple: your decisions are only as reliable as the information you base them on. If your data is a mess of inaccuracies and gaps, you're not making informed choices—you're just guessing with more steps. It's the classic "garbage in, garbage out" problem.
For data to have any real value, it needs to be both accessible to the right people and trustworthy. This means having solid processes for how you collect, clean, and manage your information. If you're serious about this, learning how to improve data quality isn't just a good idea; it's an essential first step. Without clean data, the other two pillars have nothing to stand on.
The Right Tools for the Job
With a solid data foundation in place, you need the right tools to make sense of it all. This second pillar is all about equipping your team with technology that turns raw numbers into clear, actionable insights—whether that’s a simple business intelligence (BI) dashboard or a more sophisticated analytics platform.
The key isn't to chase the most complex or expensive tool, but the one that actually works for your team. A great tool should:
- Visualize Data Clearly: It turns dense spreadsheets into charts and graphs that make trends and patterns jump out.
- Automate Reporting: It saves your team from the mind-numbing task of manual report building, freeing them up to focus on analysis.
- Enable Self-Service: It empowers people to dig into the data and find answers themselves, without waiting in line for a data specialist.
Technology acts as the bridge between raw data and human understanding. It translates the complex language of numbers into a clear story that can guide your strategy forward.
This pillar ensures insights aren't just for a select few but are available to everyone who needs them to make better calls in their day-to-day work.
People Armed with Data Literacy
The final pillar is, without a doubt, the most important: your people. You can have flawless data and the best tools on the market, but they’re just expensive decorations if your team doesn't know what to do with them.
Data literacy is the ability for everyone in the organization—not just the analysts—to read, understand, question, and communicate with data. It’s about cultivating a company-wide mindset of curiosity and critical thinking.
When your team is data-literate, they feel confident enough to challenge old assumptions and ask "why?" with evidence to back it up. For any leader looking to make this happen, understanding the steps for building a data culture effectively is a huge advantage. This is how data becomes a shared language, turning every employee into a contributor to a smarter business.
A Framework for Making Smarter Decisions
Knowing you need a data-driven culture is one thing. Actually building one is a whole different ballgame. To move from the abstract idea of data-driven decision making to a practical, everyday tool, you need a clear and repeatable process. Think of this framework as your roadmap, guiding you from a fuzzy problem to a confident, evidence-backed solution.
It's not a one-and-done checklist; it's a cycle. Every decision you make and measure generates new data, which then fuels the next round of smarter choices. This constant loop of learning and refining is where the real magic happens.
This infographic lays out the key stages in this repeatable process.
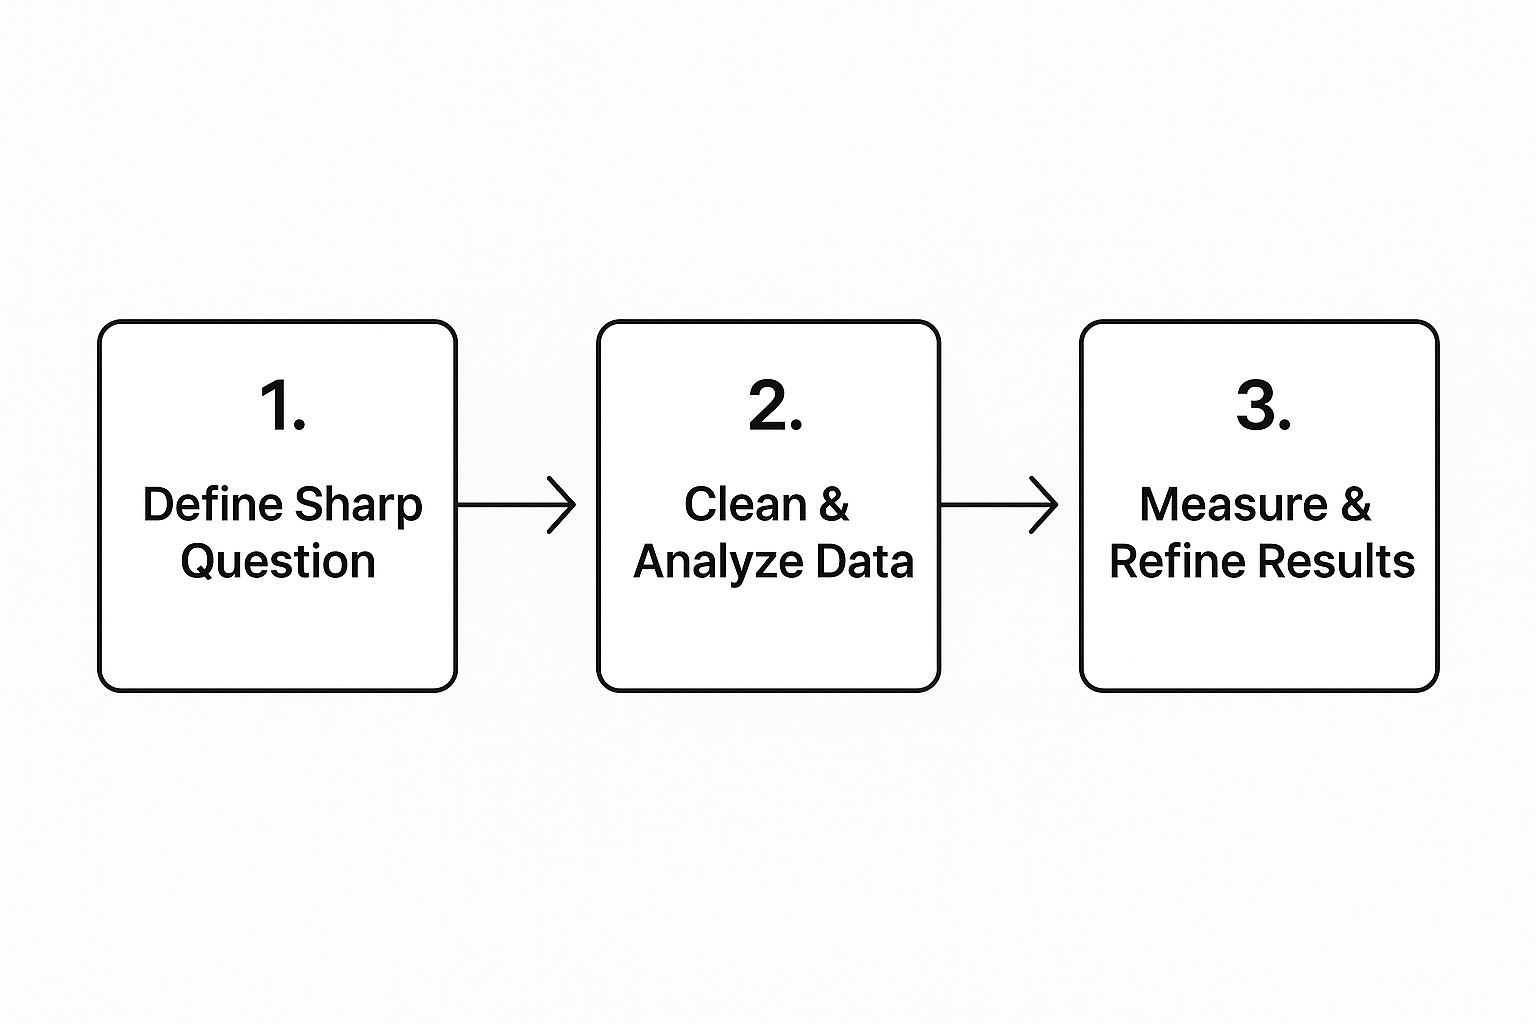
As you can see, the journey starts with a sharp question and ends in a continuous cycle of measuring and improving.
Start With a Sharp Question
Everything hinges on this first step. Before you even think about opening a spreadsheet or a dashboard, you have to define precisely what you're trying to solve. Vague goals like "increase sales" are dead ends. A good question is specific, measurable, and tied directly to a business outcome.
For instance, don't ask, "How can we get more customers?" Instead, ask, "Which of our top three marketing channels from Q2 generated the highest customer lifetime value, and why?" That level of specificity focuses your entire data-gathering effort and saves you from wasting countless hours chasing ghosts.
Hunt for the Right Data
With a clear question locked in, it's time to find and gather the information you need. This almost always means pulling data from several places.
- Customer Relationship Management (CRM) systems hold the keys to your sales cycles and customer interactions.
- Web analytics tools like Google Analytics reveal how users behave on your site and where they convert.
- Customer surveys and feedback provide the qualitative story behind the numbers—the "why" of user satisfaction or frustration.
The goal here is to pull together a complete dataset that speaks directly to the question you asked. This is where knowing what is business intelligence reporting gives you a massive leg up, helping you visualize and compile all this information coherently.
Clean and Analyze Your Findings
Let's be honest: raw data is almost always a mess. It's estimated that data analysts spend up to 80% of their time just cleaning and organizing data before the real analysis can even start. This is a non-negotiable step that involves getting rid of duplicates, fixing errors, and structuring the information so it makes sense.
Once your data is clean, you can start looking for patterns, connections, and outliers. This is the "aha!" moment, where you transform rows of numbers into a story that shows what's really going on in your business.
The point of analysis isn't just to find answers. It's to uncover the right questions you didn't even know you should be asking. Data has a knack for revealing surprising truths that can shatter long-held assumptions.
Translate Data Into Strategy
An insight is just an interesting fact until you connect it to a business goal. This step is all about interpreting what you found and turning it into a strategic recommendation. If your analysis shows that leads from social media have a low conversion rate but a surprisingly high lifetime value, what should you do with your budget?
Your conclusion should be a clear, defensible recommendation rooted in the evidence. Something like: "The data suggests we reallocate 15% of our paid search budget to a targeted social media campaign aimed at high-value customer lookalikes."
Act on Your Insights
This is where the rubber meets the road. Based on your strategic recommendation, you build an action plan. This plan needs to be just as specific as your initial question, detailing who is responsible for what, the exact steps to take, and the timeline for getting it done.
Measure and Refine
The final step brings everything full circle. After you've put your decision into action, you have to track its impact using the key performance indicators (KPIs) you defined upfront. Did reallocating the budget actually increase customer lifetime value? Did that new feature reduce churn like you thought it would?
This feedback is gold. It doesn’t just tell you if your decision paid off; it gives you fresh data that sharpens your understanding, setting you up to make an even smarter decision the next time around.
How Real Companies Win with Data

It's one thing to talk about frameworks and theories, but the real magic of data-driven decision-making happens when you see it in the wild. The best way to grasp its impact is to look at how actual companies use data to untangle tricky problems and get ahead.
These examples aren't just hypotheticals; they show how a data-first mindset gives businesses a genuine competitive edge. From shoring up customer loyalty to getting more from every marketing dollar, data acts as a roadmap for smarter growth. Let’s dive into a few real-world scenarios from B2B, SaaS, and e-commerce.
Boosting SaaS Retention by Fixing Product Friction
Imagine a growing SaaS company noticing a slow, nagging increase in customer churn. Instead of calling a brainstorming meeting to guess why people were leaving, they dug into their user engagement metrics. By tracking how customers actually used their platform, they found a single feature that was a major source of frustration and was causing a surprising number of users to give up.
The data painted a clear picture: a confusing UI in a critical workflow was the culprit. Armed with this proof, the product team redesigned that specific part of the app, guided by the behavior patterns they observed.
The results were impressive.
- The updated feature saw a 40% increase in successful completions.
- Within just three months, overall customer retention improved by a solid 15%.
This is a perfect example of how granular product data can pinpoint the exact source of a problem, leading to surgical fixes that have a huge impact.
Data allows you to move beyond asking "What do our customers want?" to observing "What are our customers actually doing?" This shift from assumption to observation is the core of effective product development.
Doubling Marketing Leads by Reallocating Ad Spend
A B2B marketing team was feeling the pressure. Their budget felt stretched thin across too many channels, and while leads were coming in, the quality was all over the place. Crucially, they couldn't confidently say which campaigns were actually making the company money. Their fix? They built a robust campaign attribution model.
This new model connected the dots between their marketing spend and real sales outcomes. The data quickly showed that one channel, while generating a ton of leads, almost never resulted in a closed deal. Another channel produced fewer leads, but they were the right leads.
Based on this evidence, they made a decisive move. They pulled a large chunk of their ad budget from the underperforming channel and funneled it into the high-quality one. The outcome was almost immediate: they doubled their marketing-qualified leads (MQLs) in just one quarter.
Cutting E-commerce Waste with Predictive Inventory
An e-commerce business was caught in a classic, costly trap: overstocking. They had too much cash tied up in products that weren't moving, forcing them into constant clearance sales that ate into their profits. To break the cycle, they turned to their historical sales data and current market trends.
By weaving these two data sources together, they created a predictive inventory model. This system could forecast demand for specific products far more accurately than their old manual methods ever could. They finally knew how much to order and when to order it. This shift led to a 30% reduction in overstock, freeing up capital and boosting their profit margins significantly.
Navigating Common Data-Driven Roadblocks
Making the switch to a data-driven culture is a game-changer, but let's be honest—it’s never a perfectly smooth ride. Nearly every organization runs into the same handful of bumps in the road. Knowing what these obstacles are ahead of time is half the battle, allowing you to plan for them instead of being blindsided.
The real secret to a successful data-driven transformation isn't about avoiding problems altogether. It’s about having a smart, practical plan to tackle them as they pop up. This journey goes way beyond just installing new software; it's about getting your data, your culture, and your team's skills all pointing in the same direction.
The Garbage In, Garbage Out Problem
The most common and critical roadblock is simply bad data. Your insights, your strategies, your big decisions—they are only as reliable as the information you feed into them. If your analytics tools are running on data that's incomplete, inconsistent, or just plain wrong, your conclusions will be shaky at best and damaging at worst.
This is the classic "garbage in, garbage out" scenario. It kills momentum and, even more importantly, erodes trust in the very data you're trying to champion. It's a massive issue across the board; some studies show data professionals spend a staggering 80% of their time just cleaning and organizing data before any real analysis can even start.
The only way to fix this is with strong data governance. This means setting clear, consistent rules for how data is collected, stored, and managed across the entire company, ensuring it's trustworthy from the get-go.
Deep-Rooted Resistance to Change
Sometimes, the biggest hurdle isn’t technical at all—it’s human. People naturally get comfortable with their routines. When a team has relied on gut feelings and "the way we've always done things" for years, asking them to suddenly lead with data can feel like a threat to their expertise.
This resistance usually stems from a place of uncertainty. Team members might worry that data will prove their experience wrong, or they might just feel intimidated by the new tools and processes. It’s a cultural barrier that can bring progress to a grinding halt.
The most effective way to overcome resistance is to demonstrate value quickly. Don't try to boil the ocean. Instead, launch small, focused pilot projects that solve a specific, painful problem and deliver a clear win.
For instance, you could use sales data to find and fix one specific bottleneck that's been slowing down the entire pipeline. Once the team sees a tangible, positive result with their own eyes, that skepticism starts to melt away. This strategy builds momentum and makes a far more compelling case for wider adoption than any top-down mandate could.
The Growing Data Literacy Gap
Let's say you have perfect data and a team that's fully on board. You can still hit a wall if your people don't have the skills to actually understand and use the data in front of them. This is the data literacy gap—the chasm between the need for data skills and the team's actual ability to interpret and apply data insights.
You don't need everyone to become a PhD-level data scientist. But you do need everyone who makes decisions to have a foundational ability to read a chart, ask smart questions about the data they're given, and understand the core metrics that drive their part of the business.
Closing this gap requires a deliberate investment in your people. This doesn't have to mean a massive training budget. You can start small and make a big impact with things like:
- Focused Workshops: Run training sessions on the specific tools and reports teams use every day.
- Accessible Resources: Create simple cheat sheets or short video tutorials on key data concepts.
- Mentorship Programs: Pair up your data-savvy employees with those who are still building their confidence.
When you bridge this gap, data-driven decision-making stops being a buzzword and becomes a real, shared capability across the entire organization.
Common DDDM Roadblocks and Solutions
To help you get ahead of these issues, it's useful to see them laid out with clear, actionable solutions. The table below summarizes the most common challenges organizations face on their data-driven journey and provides practical steps you can take to overcome them.
| Challenge | Description | Actionable Solution |
|---|---|---|
| Poor Data Quality | Data is inconsistent, inaccurate, or incomplete, leading to unreliable insights and a lack of trust in analytics. | Implement a data governance framework that defines standards for data collection, storage, and management. Start with a data audit to identify and clean up the most critical datasets first. |
| Cultural Resistance | Employees are accustomed to relying on intuition and resist new, data-centric processes, fearing it devalues their experience. | Start with small pilot projects that solve a specific, visible problem. Showcase these "quick wins" to demonstrate tangible value and build buy-in from the ground up. |
| Data Literacy Gap | Team members lack the fundamental skills to interpret data, read charts, or ask critical questions about the numbers. | Launch targeted training programs like workshops on specific tools, create a library of accessible learning resources, and establish a mentorship program to foster peer-to-peer learning. |
| Siloed Data | Information is trapped within different departments (e.g., marketing, sales, product), making it impossible to get a complete view of the customer or business. | Invest in a centralized data warehouse or platform that integrates data from various sources. Champion cross-functional projects that require departments to share and collaborate on data. |
Thinking through these potential roadblocks proactively gives you a massive advantage. Instead of reacting to problems, you’ll have a playbook ready to keep your data-driven initiatives on track and moving forward.
The Future of Decision Making with AI
The world of data-driven decisions is getting a serious upgrade, thanks to artificial intelligence (AI) and machine learning. We're not just talking about speeding up old processes; we're talking about asking entirely new questions and getting answers that were once out of reach.
For a long time, data analysis was like driving by looking in the rearview mirror. It was all about understanding what had already happened. AI flips the script, shifting our focus from the past to the future and completely changing how we think about strategy.
From Hindsight to Foresight
The true game-changer with AI is its knack for moving beyond simple historical reports. It adds a layer of intelligence that helps businesses get ahead of the curve instead of just reacting to it.
This shift really comes down to two major leaps forward:
- Predictive Analytics: This is where AI combs through historical data to make educated guesses about what’s coming next. It takes us from asking "What happened?" to "What will happen?" To dig deeper, check out our guide on what is predictive analytics.
- Prescriptive Guidance: This is the next frontier. AI doesn't just predict an outcome; it actually recommends the best steps to take to get the result you want. It answers the ultimate business question: "So, what should we do about it?"
Think of AI as a powerful magnifying glass. It can spot tiny patterns, hidden connections, and strange outliers in your data that a human analyst would almost certainly miss. This gives you a much richer understanding of what drives your business and where the risks are.
AI does the grunt work of digging through mountains of data, which frees up your team to focus on the big picture—strategy, creativity, and making the final call. This isn't just a niche trend, either. By 2025, it's expected that nearly 65% of organizations will be using or exploring AI for their data analytics. You can learn more about this shift and how AI will revolutionize decision-making on datahubanalytics.com.
Still Have Questions? Let's Clear a Few Things Up
Even with a solid plan, putting data-driven principles into practice can bring up some common questions. Let's tackle a few of the most frequent ones to help you smooth out the bumps on the road to implementation.
Is This Just for Big Companies, or Can Small Businesses Do It Too?
Absolutely. You don't need a Fortune 500 budget to be data-driven. The core principles scale down perfectly.
Small businesses can start right now with accessible tools. Think about using Google Analytics to see how visitors actually use your website, or digging into your sales data to find your most popular products. Even simple customer surveys can give you a goldmine of direct feedback.
The secret is to start with a specific question you can actually answer with the data you already have. You don't need a massive data warehouse to make smarter choices; you just need to be deliberate.
How Do I Balance Data with My Own Gut Feelings and Experience?
This is a huge one. Being data-driven isn't about letting a spreadsheet run your business. It's about giving your intuition a reality check. Data provides the objective evidence to either back up your gut feeling or challenge it, leading to much stronger decisions.
Here’s an analogy: think of data as your map and compass. It shows you the terrain and points you in the right direction. But your creativity and experience are what you, the captain, use to actually navigate the ship through the water. The best leaders use data to see the whole picture and reduce risk, then apply their expertise to interpret what it all means and chart the best course forward.
What's the Very First Step to Building a Data-Driven Culture?
The single most important first step is getting buy-in from leadership. After that, start small. Don't try to boil the ocean and change the entire company at once. Instead, pick one specific, high-impact business problem that data can help solve.
Assemble a small team, give them the tools they need, and aim for a clear, measurable win. For example, analyze your support tickets to find the #1 most common complaint and then solve it.
Once you prove the value of this approach with a successful pilot project, you create momentum. That initial success story makes it infinitely easier to get everyone else on board for bigger changes.
Ready to stop guessing and start growing? MakeAutomation specializes in building the automated, data-centric systems that B2B and SaaS companies need to scale effectively. We'll help you implement the frameworks to turn your data into your most powerful asset. Learn how we can optimize your operations today!