
Cypress Integration Tests A Practical Guide for B2B and SaaS
Cypress integration tests are all about making sure the different pieces of your web application play nicely together. While unit tests are great for checking tiny, isolated bits of code, integration tests mimic how a real person would use your app. Think of complex flows like a customer signing up, filling out a multi-page form, or completing a checkout process—these tests verify that everything works correctly from start to finish.
Why Modern SaaS Teams Choose Cypress

Before you write a single test, it’s worth understanding why so many B2B and SaaS teams are migrating from older testing tools. Cypress isn't just another framework; it represents a significant shift in how development and QA teams approach quality. It was built from the ground up to solve the persistent, frustrating problems that have slowed down projects for years.
When you look at why so many teams are making the switch, the architectural differences between Cypress and older frameworks really stand out.
A New Architecture for Reliable Testing
The secret sauce is how Cypress is built. It runs directly inside the browser, in the very same run-loop as your application. This gives it native, unrestricted access to every object, function, and element on the page. You don't need to mess with complex driver layers or APIs, which is a common source of headaches with traditional tools like Selenium.
This unique design offers some game-changing advantages, especially for fast-moving teams:
- Less Flakiness: Because it runs alongside your app, Cypress has built-in automatic waiting. It intelligently waits for commands and assertions to resolve, which gets rid of the random, unpredictable test failures caused by manual waits and sleeps.
- Faster Feedback: The interactive Test Runner is a developer's dream. It gives you a visual timeline of every action, DOM snapshot, and network request, making debugging incredibly fast and intuitive.
- Total Control: You get the power to stub network requests, manipulate your application's state, and even control time. This lets you create perfectly isolated and predictable tests for almost any scenario you can imagine.
By integrating a solid framework like Cypress, SaaS teams can more effectively implement agile development best practices and ship high-quality features with confidence. The numbers back this up. In 2025, Cypress saw a huge spike in use, with about 35% of web development companies adopting it as their main testing tool. That's a 5% increase from 2024, and forecasts for 2026 predict it will climb to 40%, largely due to its developer-friendly experience. You can find more details on these trends in this Cypress adoption statistics report.
To put it in perspective, let's quickly compare Cypress to what you might be used to.
Cypress vs Traditional Testing Frameworks
| Feature | Cypress | Traditional Frameworks (e.g., Selenium) |
|---|---|---|
| Architecture | Runs inside the browser alongside the app. | Runs outside the browser, executing remote commands. |
| Debugging | Interactive GUI, time-travel, DOM snapshots. | Relies on terminal logs and requires manual debugging. |
| Test Flakiness | Automatic waiting for elements and commands. | Prone to race conditions; requires manual waits/sleeps. |
| Network Control | Native ability to stub and spy on network requests. | Requires third-party tools or complex proxy setups. |
| Setup | Simple npm install with minimal configuration. |
Often requires separate driver and library installations. |
This table shows why Cypress feels like such a breath of fresh air. It’s not just a different tool—it's a fundamentally different and more direct way to test modern web applications.
The Business Impact of Better Testing
For project managers, founders, and anyone focused on the bottom line, these technical perks translate directly into business wins. Reliable tests and quick feedback loops mean you can release features more frequently and with greater confidence. When your team trusts their test suite, they can build and ship without constantly worrying about breaking something.
Cypress is not just a tool for finding bugs; it's a tool for increasing development velocity. It empowers teams to build with confidence, knowing they have a safety net that catches issues before they impact customers.
This guide is designed for the real world. We'll go way beyond basic "hello world" examples to show you how to apply Cypress to the complex challenges common in high-growth B2B and SaaS products. Our goal is to set you up with a testing strategy that scales with your business.
Setting Up Your First Cypress Project for a Real-World App
Getting started with a new testing framework should be exciting, not a chore. We're going to skip the generic "hello world" examples and jump right into a practical walkthrough for installing and configuring Cypress in a project that mirrors a real B2B application.
The goal here is to lay down a solid, scalable foundation for your cypress integration tests. A proper setup from day one saves you from massive headaches down the road and ensures your test suite can grow alongside your app.
Initializing Your Project
First things first, pop open your terminal and head to your project’s root directory. Cypress needs a package.json file to manage its dependencies. If you don't have one, you can create it with a single command.
Run this to generate a default package.json file:
npm init -y
With that in place, you’re ready to install Cypress. We'll add it as a development dependency, which is the best practice. This locks the Cypress version to your project, so you won't get caught off guard by unexpected updates breaking your tests.
npm install cypress –save-dev
This one command handles everything—it downloads Cypress and neatly adds it to your node_modules folder and package.json. No messy global installations or complex driver configurations needed. It just works.
Launching Cypress and Generating the Project Structure
Once the installation wraps up, it’s time for the magic to happen. We'll open Cypress for the first time using npx, a handy tool that runs the Cypress executable from your local project dependencies.
From your project's root, execute this command:
npx cypress open
The first time you run this, Cypress springs into action, scaffolding out a complete project structure for you. It creates a cypress.config.js file for all your configurations and a cypress folder to house your tests. This gives you a clean, organized starting point right out of the box.
Pro Tip: Running
npx cypress openlaunches the interactive Test Runner. It'll walk you through configuring your first E2E (End-to-End) test suite, which is exactly what we need for our integration tests.
Understanding the Cypress Folder Structure
After that initial run, you'll find a new cypress folder in your project. Getting familiar with what goes where is key to keeping your tests organized and easy to manage as your project grows.
cypress/e2e: This is where the action is. All of your test files (we call them "specs") will live here. Cypress automatically finds any files ending in.cy.jsin this directory and displays them in the Test Runner.cypress/fixtures: Think of this as your test data pantry. It’s the perfect spot to store static JSON files, like sample user profiles, API responses, or any other predictable data your tests rely on.cypress/support: This folder is your secret weapon for writing clean, DRY (Don't Repeat Yourself) tests. It holds reusable code and configurations that run before your tests. It's the ideal place to create custom commands (like acy.login()function) or tweak Cypress's default behavior.
Inside the support folder, two files are particularly important:
| File | Purpose |
|---|---|
e2e.js |
This file runs before every single spec file. It's great for importing global styles or setup code. |
commands.js |
This is where you'll define custom commands to simplify complex actions and make your tests way more readable. |
Writing Your First Meaningful Test
Enough setup—let's write a test that actually provides value. Instead of something trivial, we'll test a crucial user flow for any SaaS app: making sure the login page loads correctly.
Start by creating a new file named login.cy.js inside your cypress/e2e directory.
Now, add this code to your new file:
describe('Login Page', () => {
it('should display the login form and relevant elements', () => {
// Visit the login page of our application
cy.visit('/login');
// Assert that the main heading is visible
cy.get('h1').contains('Welcome Back').should('be.visible');

// Check for the email and password input fields
cy.get('input[name="email"]').should('be.visible');
cy.get('input[name="password"]').should('be.visible');

// Verify the "Sign In" button is present and not disabled
cy.get('button[type="submit"]').contains('Sign In').should('be.visible').and('not.be.disabled');
});
});
While simple, this test is incredibly useful. It quickly verifies that the core components of your login page are rendering and are ready for interaction. With this foundational setup complete, you're now perfectly positioned to build out more complex cypress integration tests and gain real confidence in your application.
Writing Scalable Tests for Complex SaaS Workflows
Testing a simple login page is a fine start, but the real power of cypress integration tests shines when you start tackling the complex, multi-step journeys your users take every day. For a B2B or SaaS app, this could be anything from a full onboarding sequence to creating and managing tasks on a collaborative project board.
These are the core workflows that make or break your customer experience, and they're exactly what you need to protect with solid tests.
As you write more tests, you'll quickly run into a familiar problem: repetition. Just about every test needs a logged-in user. Manually writing cy.visit('/login'), cy.get(...), and cy.click() in every single test file isn't just inefficient—it's a maintenance nightmare waiting to happen.
This is where building for scale becomes non-negotiable. We need strategies to cut down on code duplication, boost readability, and make our tests simple to update when the app changes. Thankfully, the Cypress ecosystem gives us two fantastic patterns for this: Custom Commands and the Page Object Model (POM).
Streamlining Repetitive Actions with Custom Commands
Think of Custom Commands as your secret weapon for creating clean, reusable test logic. They let you bundle a series of Cypress actions into a single, descriptive command, like creating your own specialized functions for your application's unique workflows.
Let's start with the most common culprit: logging in. Instead of writing out the login steps over and over, we can build a cy.login() command.
You'll add this to your cypress/support/commands.js file, which is the designated home for all your custom commands.
// In cypress/support/commands.js
Cypress.Commands.add('login', (email, password) => {
cy.session([email, password], () => {
cy.visit('/login');
cy.get('input[name="email"]').type(email);
cy.get('input[name="password"]').type(password);
cy.get('button[type="submit"]').click();
// Ensure the app has redirected to the dashboard
cy.url().should('include', '/dashboard');
});
});
See that cy.session() wrapper? That's a game-changer. It caches the browser session (cookies, local storage, etc.) after a successful login. The next time a test calls cy.login(), Cypress just restores the session instead of re-running the entire UI flow. This alone will save you a massive amount of execution time.
With this command in place, your test files become wonderfully simple and self-explanatory:
// In cypress/e2e/dashboard.cy.js
describe('Dashboard Functionality', () => {
beforeEach(() => {
// A single, readable command handles authentication
cy.login('testuser@example.com', 'SuperSecret123');
cy.visit('/dashboard');
});
it('should display the user's projects', () => {
cy.get('.project-list').should('be.visible');
});
});
This approach is a foundational step in building a maintainable test suite. Now, if your login UI ever changes, you only need to update the logic in one place: the commands.js file.
Organizing Your Tests with the Page Object Model
While Custom Commands are perfect for actions, the Page Object Model (POM) is a design pattern for organizing your element selectors. The idea is to create a dedicated class for each page or major component in your application. This class holds all the selectors and methods needed to interact with that piece of the UI.
The main advantage here is decoupling your tests from your application's structure. When a developer inevitably changes a selector—maybe switching from a CSS class to a data-testid attribute—you only have to update it in one file (the Page Object) instead of hunting it down across dozens of tests.
Let's build a simple Page Object for a "Project Settings" page. A good practice is to create a new folder, cypress/pages, to keep things organized.
// In cypress/pages/ProjectSettingsPage.js
class ProjectSettingsPage {
get projectNameInput() {
return cy.get('[data-testid="project-name-input"]');
}
get updateSettingsButton() {
return cy.get('[data-testid="update-settings-btn"]');
}
get notificationMessage() {
return cy.get('.notification-success');
}
updateProjectName(newName) {
this.projectNameInput.clear().type(newName);
this.updateSettingsButton.click();
}
}
export default new ProjectSettingsPage();
Now in your test file, you can import this Page Object and write tests that are far more descriptive and resilient to change.
// In cypress/e2e/project_settings.cy.js
import ProjectSettingsPage from '../pages/ProjectSettingsPage';
describe('Project Settings', () => {
beforeEach(() => {
cy.login('testuser@example.com', 'SuperSecret123');
cy.visit('/projects/1/settings');
});
it('should allow a user to update the project name', () => {
const newName = 'My Awesome New Project Name';
ProjectSettingsPage.updateProjectName(newName);
ProjectSettingsPage.notificationMessage
.should('be.visible')
.and('contain', 'Settings updated successfully');
});
});
By combining Custom Commands for actions and Page Objects for selectors, you create a powerful, multi-layered abstraction. This structure is the key to writing cypress integration tests that are not only robust but also easy for new team members to understand and contribute to.
These patterns are fundamental to a healthy testing culture. For more ideas on weaving quality into your development process, have a look at our guide on testing best practices in Agile environments. Adopting these strategies early on will ensure your test suite remains a valuable asset, not a technical debt burden, as your SaaS application grows.
Controlling Test Data and Network Requests
Let's be honest: your tests are only as reliable as the environment they run in. If you're hitting a live, unpredictable backend for every test run, you're setting yourself up for a world of pain. It’s a recipe for slow, flaky, and expensive cypress integration tests.
This whole section is about taking back control.
Every time your tests rely on a real-time server response, you're injecting variables you can't manage. What happens when the API is down for maintenance? Or when another developer pushes a change that alters the exact data your test was expecting? Your tests will start failing for reasons that have absolutely nothing to do with the feature you're actually trying to ship.
Creating Predictable States with Fixtures
Cypress fixtures are the first tool we'll pull out of our toolbox to build a stable testing world. Just think of the cypress/fixtures directory as your personal pantry, always stocked with consistent, predictable test data. You can pop JSON files in there and then load them directly into your tests.
For example, say you're testing a user dashboard that displays a list of projects. Instead of praying the database has the right data, you can create a projects.json file right in your fixtures folder.
// In cypress/fixtures/projects.json
[
{ "id": 1, "name": "Project Alpha", "status": "Active" },
{ "id": 2, "name": "Project Beta", "status": "Archived" },
{ "id": 3, "name": "Project Gamma", "status": "Pending" }
]
This simple file gives you a perfect, unchanging dataset. From now on, your tests will always run against this exact data, every single time. This is a foundational move toward creating truly isolated and deterministic tests.
By decoupling your frontend tests from the backend's ever-changing state, you eliminate a massive source of flakiness. Your tests immediately become faster and more reliable because they're no longer waiting on external services to be available or to return a specific payload.
Intercepting Network Requests to Isolate the Frontend
Fixtures give us the data, but cy.intercept() is where the real magic happens. This powerful command lets you "catch" any outgoing network request your application makes and decide what to do with it. You can let it pass through, tweak it on the fly, or—most importantly—completely replace its response with your own mocked data.
It’s a total game-changer for testing different UI states without ever touching a real server. With cy.intercept(), you can simulate any API scenario you can dream up.
Here’s a practical look at how you can test three common states of any data-fetching component:
1. Successful Data Load
First, we'll tell Cypress to intercept the GET request to /api/projects and respond with our fixture data instead of letting it go to the server.
// Tell Cypress to watch for this request and serve our local file
cy.intercept('GET', '/api/projects', { fixture: 'projects.json' }).as('getProjects');
// Now, visit the page
cy.visit('/dashboard');
// It's good practice to wait for the mocked request to resolve
cy.wait('@getProjects');
// Assert that the UI has rendered our 3 projects
cy.get('.project-list').should('have.length', 3);
2. Loading State
You can even introduce an artificial delay to the response. This is perfect for making sure your loading spinners or skeleton screens are working as expected.
cy.intercept('GET', '/api/projects', {
fixture: 'projects.json',
delay: 500 // Wait 500ms before responding
}).as('getProjects');
cy.visit('/dashboard');
// The spinner should be visible immediately
cy.get('.spinner').should('be.visible');
// After waiting, the data should be loaded and the spinner gone
cy.wait('@getProjects');
cy.get('.spinner').should('not.exist');
3. Error State
What if the API throws an error? Simulating a 500 server error is just as easy. This lets you confirm that your app fails gracefully and shows a helpful message to the user.
cy.intercept('GET', '/api/projects', {
statusCode: 500,
body: { message: 'Internal Server Error' }
}).as('getProjectsError');
cy.visit('/dashboard');
// Wait for the intentional error
cy.wait('@getProjectsError');
// Check that our friendly error message is displayed
cy.get('.error-message').should('contain', 'Something went wrong');
Gaining this level of control is absolutely critical for building a comprehensive suite of cypress integration tests. Once you master the combination of fixtures and cy.intercept(), you effectively build a fortress around your frontend, making your tests faster, more reliable, and completely independent of backend chaos. For a deeper look into handling information across systems, you might be interested in our guide on data integration best practices.
Integrating Cypress into Your CI/CD Pipeline
Let's be honest: tests that only run on your local machine are just another manual chore. The real magic happens when your Cypress integration tests are woven directly into your development lifecycle, running automatically every time code changes. This is where a CI/CD (Continuous Integration/Continuous Deployment) pipeline comes in, and it's a total game-changer.
Think of it as an automated quality gatekeeper. It’s the final, crucial step that transforms your test suite from a personal tool into a powerful team asset, ensuring that only quality code makes its way toward production. If you're just starting out, building your DevOps pipeline can seem daunting, but it's the foundation for true continuous delivery.
Configuring for Automated Runs
The first mental shift is moving from interactive to automated runs. When you're writing and debugging, npx cypress open is your best friend. It fires up the Test Runner GUI, which is fantastic for that hands-on work.
But in a CI/CD environment, there’s no one watching the screen. For that, we use cypress run. This command is built specifically for automation. It executes your tests headlessly (without a visible browser) and, by default, records videos of the entire run—an absolute lifesaver for debugging those tricky failures that only seem to happen in CI.
You can easily set this up in your package.json with a simple script:
"scripts": {
"test:ci": "cypress run"
}
With that in place, your CI server just needs to execute npm run test:ci, and your entire test suite will spring into action.
A Real-World Example with GitHub Actions
GitHub Actions is a great place to start with CI because it's so tightly integrated with your code. To get Cypress running, you just need to add a YAML file to your project in the .github/workflows/ directory. This file tells GitHub what to do and when—for instance, running your tests after every push to the main branch.
Here’s a practical configuration that I’ve used on many projects:
name: Cypress Tests
on: [push]
jobs:
cypress-run:
runs-on: ubuntu-latest
steps:
– name: Checkout
uses: actions/checkout@v3
  - name: Install dependencies
    run: npm install

  - name: Cypress run
    uses: cypress-io/github-action@v6
    with:
      # Starts a server and waits for it to be ready
      start: npm start
      wait-on: 'http://localhost:3000'
      # Runs tests headlessly
      browser: chrome
This workflow is pretty straightforward: it checks out your code, installs your dependencies, and then uses the official Cypress GitHub Action. This action is a huge time-saver; it handles caching and other optimizations behind the scenes to make your CI runs as fast and efficient as possible. For a deeper dive into the whole process, our guide on DevOps and continuous delivery is a great resource.
Unlocking Insights with the Cypress Dashboard
Running tests in CI is one thing, but digging through endless terminal logs to figure out why a test failed is a nightmare. This is exactly the problem the Cypress Dashboard was built to solve.
Think of the Dashboard as your mission control for testing. It gives you a single, centralized place to see all your test runs, complete with video recordings, screenshots on failure, and detailed logs.
To get started, you just need to set up your project in the Dashboard to get a unique projectId and a record key. Then, you add the --record flag to your run command.
cypress run --record --key <your_record_key>
That one simple change sends all your test artifacts straight to the cloud. Suddenly, you have a rich, interactive way to analyze every run. This process of controlling the test environment, as shown below, is what makes your reports so reliable.
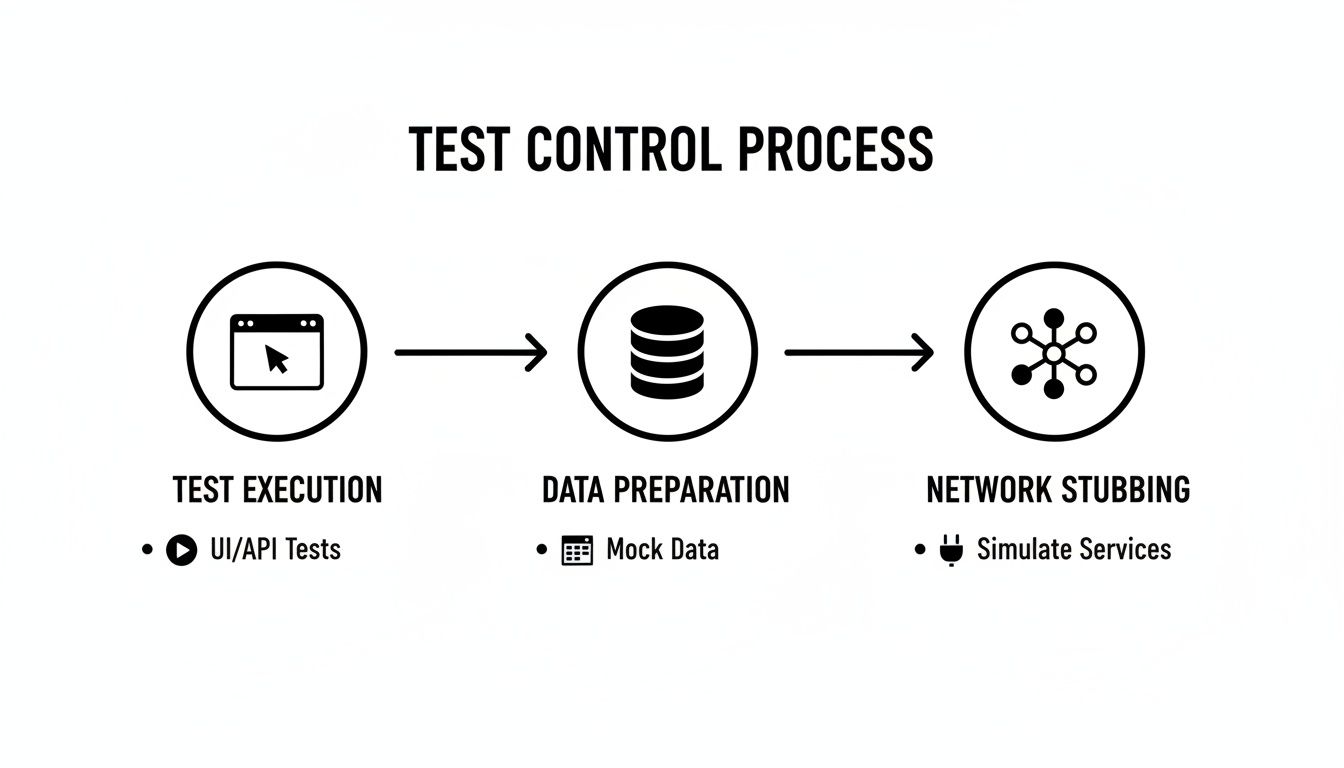
When you structure tests this way—controlling data with fixtures and stubbing network requests—you get consistent results. The Dashboard then helps you visualize these results at scale.
The impact can be massive. I've seen teams completely transform their release process with this setup. One team I worked with cut their regression testing from three days to less than five hours. Another saw a 30% drop in production defects within the first quarter of implementing a scalable Cypress testing strategy.
Best of all, the Dashboard enables test parallelization. By adding a --parallel flag and telling your CI provider to spin up multiple containers, you can run your tests simultaneously. A 30-minute test suite can suddenly finish in under five minutes, giving your team the fast feedback they need to move quickly and confidently.
Advanced Strategies for Debugging and Reporting
As your suite of Cypress integration tests starts to grow, so does the headache of managing it. A handful of tests is easy to keep an eye on, but hundreds can quickly become a tangled, unreliable mess if you're not careful. This is where you need to move beyond the basics and start thinking about advanced debugging, reporting, and tackling test flakiness. This is what separates a frustrating test suite from one that your team can actually rely on.
The goal is to build a system that doesn’t just give you a thumbs-up or thumbs-down. You need rich, actionable insights into why something broke. Get this right, and you'll save your developers countless hours and build real trust in your automation efforts.
Catching Unintended UI Changes with Visual Regression
Functional tests are great at verifying behavior—did clicking that button submit the form? But they are completely blind to what your app actually looks like. A rogue CSS change could shove a button off-screen, make text invisible, or shatter your layout, and your functional tests would still give you a green light.
This is exactly the problem visual regression testing solves. Tools like Percy plug right into Cypress and act as an automated set of eyes for your entire UI.
It's a pretty straightforward process:
- Take a Baseline Snapshot: The first time you run your tests with Percy, it takes a pixel-by-pixel screenshot of your app's pages or components. This becomes your "golden" or baseline version.
- Compare on Every Change: On subsequent test runs (like in your CI pipeline), Percy takes a new snapshot and compares it against that baseline.
- Spot the Difference: If even a single pixel has changed, Percy flags it and shows you the differences in a side-by-side view. This lets a real person decide if the change was intentional or a bug.
Getting this into a Cypress test is surprisingly simple. Once you've got it configured, you just add a single line of code at key points in your tests.
it('should display the dashboard correctly', () => {
cy.login('user@example.com', 'password123');
cy.visit('/dashboard');
// First, make sure the page is ready
cy.get('.welcome-header').should('be.visible');
// Now, take a snapshot for visual comparison
cy.percySnapshot('Dashboard Page');
});
That one simple command ensures that no visual change, big or small, ever slips into production without someone on your team giving it the okay.
Taming the Beast of Test Flakiness
I’ve seen it happen time and time again: nothing kills a team's confidence faster than a flaky test. I'm talking about that one test that passes one minute and fails the next, with zero code changes. When developers can't trust the test results, they start ignoring them. Your entire automation safety net just collapses.
Flaky tests are a silent killer of a good CI/CD culture. Actively hunting down and fixing them is one of the highest-leverage activities you can do to maintain a healthy and fast-moving development cycle.
First, you have to identify the culprits. The Cypress Dashboard is phenomenal for this, as it automatically flags tests with a history of flaky behavior. Once you've found a test that's acting up, here are some battle-tested strategies I use to stabilize it.
Best Practices for Fixing Flaky Tests
From my experience, the most common source of flakiness is when developers don't properly handle asynchronous operations. It's so tempting to just throw in a hard-coded wait.
Avoid cy.wait(number) at all costs. Seriously. Adding a cy.wait(500) is just a guess. It might work on your machine today, but it will fail when the network is a bit slower or the server takes an extra moment to respond.
Instead, lean on these much more robust techniques:
- Wait for Network Requests: If your UI is waiting on an API call, don't guess how long it'll take. Use
cy.intercept()to give that request an alias, then explicitly tell Cypress tocy.wait()for that specific alias to complete. - Assert on UI State: Rather than waiting for time to pass, wait for the UI to be in the state you expect. A classic example is asserting that a loading spinner
should('not.exist')or that a list of resultsshould('have.length.greaterThan', 0). You're waiting for the result, not the time. - Implement Smart Retries: Cypress Test Retries are a lifesaver. You can configure a failed test to automatically re-run a couple of times. This is perfect for overcoming temporary environmental hiccups—like a brief network blip—without failing your entire CI build.
By combining insightful reporting from the Cypress Dashboard, catching visual bugs with Percy, and systematically stamping out flakiness, you’ll elevate your Cypress integration tests from a simple checking tool to a powerful platform that genuinely protects quality and helps your team move faster.
Are you spending too much time on manual processes instead of growing your business? MakeAutomation specializes in building and implementing AI and automation frameworks that help B2B and SaaS companies scale efficiently. We can help you implement a world-class testing and CI/CD pipeline, reclaim your team's time, and accelerate your journey to 7-figures. Explore our automation solutions and book a discovery call today.