

AI Voice Agent ROI Calculator: Complete Guide 2026
The call queue looks healthy at 9 a.m., then the dashboard starts filling with missed calls, half-completed transfers, and voicemails that never get returned. Sales reps are still dialing cold lists, support is still triaging the same repetitive questions, and the founder is trying to answer one question that keeps getting postponed, can an AI voice agent pay for itself, or will it just add another tool to manage?
That's the right moment to reach for an ai voice agent roi calculator. Not because the math is complicated, but because gut feel breaks down once call volume, staffing pressure, and revenue leakage start moving at the same time. A credible model gives you a budget decision, not a demo opinion.
The basic cost gap is real enough to matter. Industry benchmarks put human-handled inbound calls at about $7.20 each, while AI voice-agent handling is commonly modeled around $0.30 to $1.75 per call, which is why calculators often show a 70% to 95% reduction in per-call cost depending on assumptions and scale, according to the benchmark summary on Voice Agent ROI measurement. That spread is large enough to get attention, but the core question is whether your team can prove the savings without hand-waving.
The Moment a Calculator Becomes Urgent
A founder usually does not open a calculator because they enjoy spreadsheets. The trigger is operational, missed inbound calls during peak hours, sales reps spending too much time on low-intent dials, and operations staff answering the same questions while the pipeline slows down.
The key question shifts from whether automation is possible to whether the budget can be defended. A pilot that looks inexpensive can still be the wrong move if it leaves out implementation work, human escalation, and the value of calls that never got answered. A conservative model does the opposite, it turns the pain into a number leadership can review without guessing.
Why the urgency isn't just about labor
Direct labor savings are only one part of the case. Benchmarks cited in the ROI summary on AI voice agent ROI statistics show voice-AI programs landing in the range of 3-year ROI figures above 300%, including a 391% three-year ROI benchmark and a 331% ROI over three years reported in separate industry summaries. Those figures will not map cleanly to every deployment, but they do show that the discussion has moved from novelty to measurable operations.
A second layer is measurement quality. If a calculator only shows that AI is cheaper per call, it leaves out the hard parts, how many calls were contained, how much revenue was recovered from missed opportunities, and how much internal effort went into setup and maintenance.
Practical rule: if the calculator only tells you that AI is cheaper per call, it is incomplete. The real decision is whether the savings and recovered revenue are measurable enough for finance to approve the change.
That is why the calculator should be treated as a measurement instrument. The model needs enough discipline to hold up under CFO scrutiny, otherwise it is just marketing arithmetic. If it does hold up, it can support a pilot, a budget request, or a clear no.
Defining the Benefit and Cost Lines
A useful model starts with a clean ledger. The biggest mistake is mixing everything into one “savings” bucket, then wondering why the payback looks too good to be true. Separate the benefit line from the cost line, and the logic gets a lot easier to defend.
Benefits usually fall into a few clear groups, labor savings from containment, recovered revenue from missed calls, after-hours coverage, and faster speed-to-lead. Costs belong elsewhere, platform fees, telephony, integration build, prompt work, QA, vendor management, and the internal time your team spends keeping it alive. If a line item doesn't clearly increase revenue or reduce labor, don't force it into either side.
| Category | Examples | Bucket |
|---|---|---|
| Containment benefit | Routine questions resolved by the agent | Benefit |
| Recovered revenue | Missed inbound calls that get answered | Benefit |
| After-hours coverage | Calls handled when the team is offline | Benefit |
| Speed-to-lead | Faster response to new leads | Benefit |
| Platform subscription | Monthly software or usage fees | Cost |
| Telephony | Carrier minutes and call transport | Cost |
| Integration | CRM, calendar, helpdesk connections | Cost |
| Maintenance | Prompt tuning, QA sampling, routing edits | Cost |
The dangerous part is double counting. If you count a contained call as both labor savings and recovered revenue, the model inflates itself. If you count every call as saved labor even though some still escalate to a human, the payback gets even more optimistic.
A clean rule for the spreadsheet
Use one row for each benefit and one row for each cost. Then keep the logic separate until the final summary. That way, when finance asks why the number looks strong, you can point to the exact assumption driving it instead of defending a blended estimate.
If you're mapping the use case itself, the internal guide on AI voice agent for customer service is a helpful companion, because the business case changes depending on whether the agent is reducing support load or capturing revenue.
The model gets stronger when each assumption has a home. It gets weaker the moment “savings” becomes a catch-all for everything the team hopes will improve.
The Inputs That Move the Number
A calculator gets useful when the inputs reflect how the work is done. Four fields drive most of the result: monthly call volume, average handle time, fully loaded human agent cost, and fully loaded AI cost per call. If those four are grounded in real operations, the model is usually directionally right. If one is guessed badly, the result can drift fast enough to mislead a buyer or a finance reviewer.
Call volume is where teams usually start the slide. They pick a busy month, then treat it like a normal baseline, or they count every call in the queue instead of the slice they plan to automate. That makes the model look healthier than the pilot will feel. Handle time causes a similar problem, because teams often use a best-case sample from a clean period, then discover the queue takes longer once transfers, pauses, and edge cases show up.
Cost is where the spreadsheet gets serious. Human cost should be fully loaded, not just wage. AI cost should include the full stack, not only the platform line item, because telephony, usage, support, and integration effort all affect the actual number. Independent industry sources place human calls at about $7.20 each and AI handling at roughly $0.30 to $1.75 per call, which is why the cost gap can look large even before volume is applied. The practical question is whether the benchmark matches your own queue, or whether your model needs a different range for a different call type.
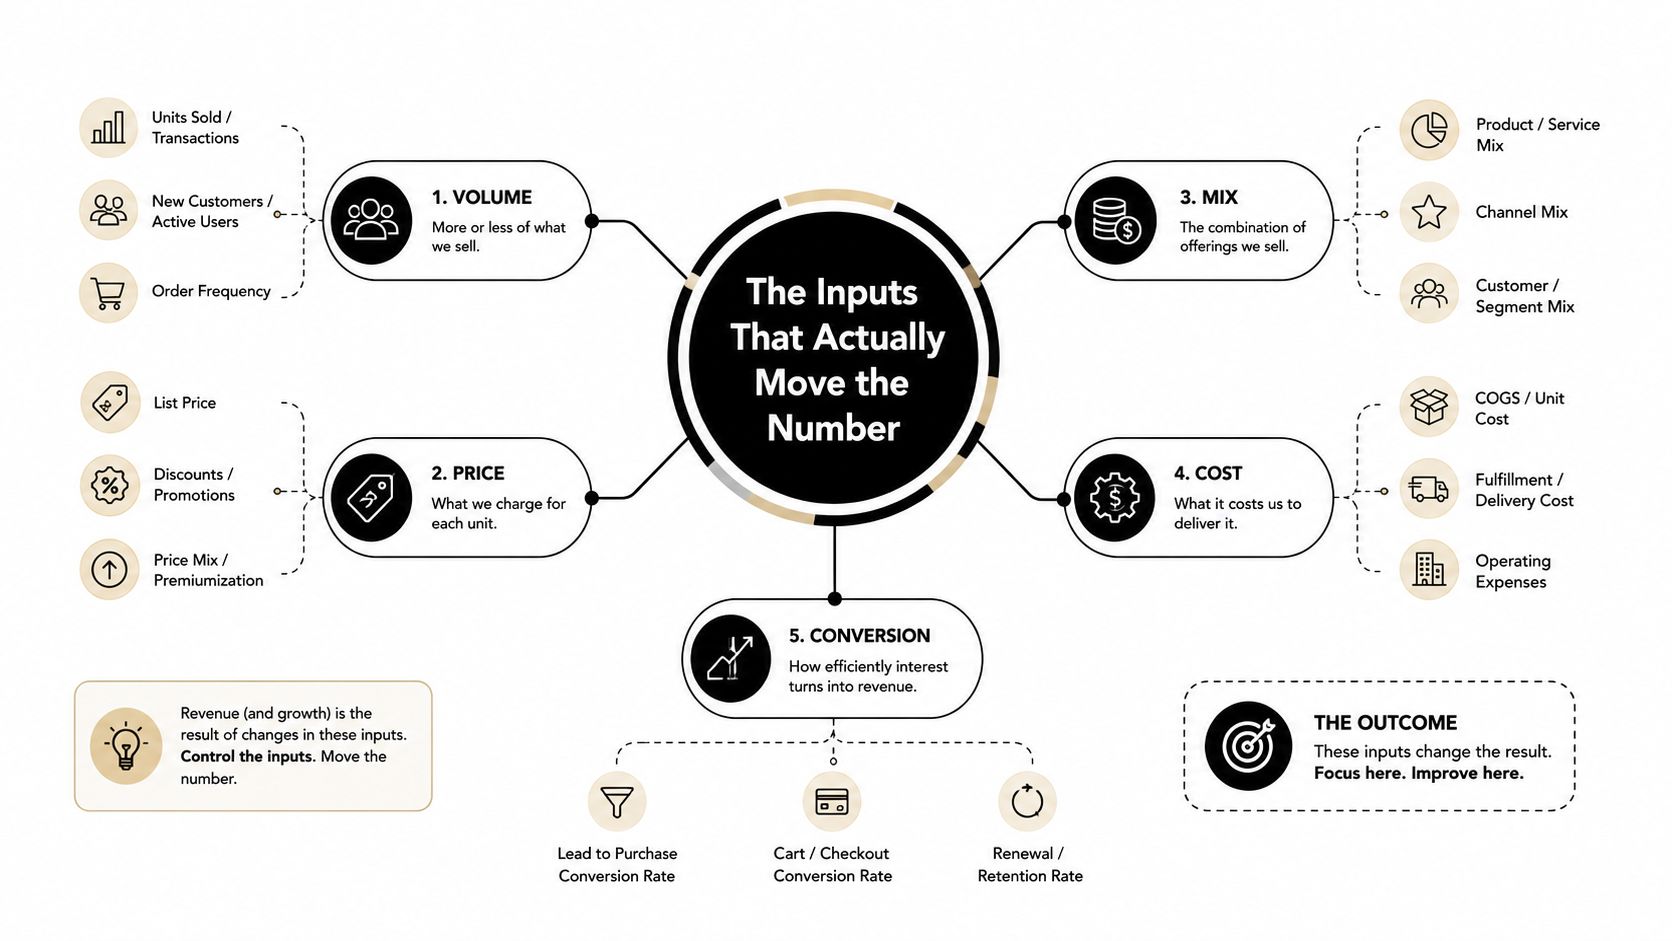
A proper ROI model also needs to behave like a measurement instrument, not a sales estimate. That means the calculator should sit beside a control-group design, so the payback number can survive CFO scrutiny instead of relying on optimistic assumptions alone. In practice, this matters most when the business case depends on more than call containment, such as a support desk or a revenue team that cares about response speed and conversion quality. For that kind of setup, AI voice agent for customer service is a useful operational reference because the economics change once the agent is tied to service outcomes, not just labor substitution.
The four cells worth defending first
- Monthly call volume: defend this with recent queue data, not a seasonal spike.
- Average handle time: use a normal operating average, then test a longer-case scenario.
- Human cost per call: make it fully loaded, because base wage understates reality.
- AI cost per call: include telephony, usage, and any support layer you'll pay for.
Small errors cascade through the model. A miss in volume or cost does not stay small when it multiplies across thousands of calls, which is why the spreadsheet cells worth challenging are always the ones tied to volume and per-call cost. If those are right, the rest of the model usually behaves.
The Core Formulas and Two Worked Examples
A calculator only becomes useful when the math is explicit. The formulas should be plain enough for a finance reviewer to audit, then specific enough to show how the result changes in two different settings, inbound support and outbound qualification.
The core arithmetic
For call-handling savings, count only the calls the AI contains. The clean structure is monthly savings = call volume × containment rate × cost difference per call. If you also want to model recovered revenue, keep that on a separate line so it does not blur the labor savings.
The input choices matter more than the formula itself. A good way to sanity-check the setup is to walk through how to calculate return on investment before you trust the spreadsheet. That keeps the model grounded in the actual economics of the use case instead of a neat-looking number that falls apart under review.
A practical inbound model starts with support traffic. Say a team handles 10,000 calls per month, average handle time is 4 minutes, and containment is 60%. If the human call is benchmarked at about $7.20 and the AI-handled version sits in the lower benchmark range cited earlier, the direct savings line grows quickly because the per-call difference multiplies across every contained call.
An outbound model works differently. Labor savings matter, but the bigger question is whether the AI reaches leads faster, after hours, and with more consistent qualification. In that case, the calculator needs room for conversion lift and lead value, not just replacement of human time.
Two scenarios, two different logics
The inbound case is mostly an efficiency story. The outbound case is mostly a revenue-quality story. That is where many teams go wrong, they copy a support model into a sales desk and then wonder why the output feels inflated or incomplete.
- Inbound support: the main benefit is containment, lower labor load, and after-hours coverage.
- Outbound qualification: the main benefit is speed-to-lead and more consistent lead handling.
- Common mistake: using the same revenue assumption for both, even though the economics are different.
As noted earlier, benchmark summaries for AI voice agent ROI show that payback can look short in high-volume environments with higher human handling costs, while smaller teams usually need a longer horizon. That is useful context, but only if the assumptions match your queue, your staffing mix, and your actual AI cost structure.
If you want the calculator to hold up in a budget meeting, show the formula, the input values, and the assumption source side by side. That is what turns a promise into a model.
Proving the ROI Is Real, Not Just Optimistic
Most public calculators stop after arithmetic. That's a problem, because “before and after” comparisons get distorted by seasonality, campaign changes, and team turnover. If inbound traffic rose because marketing launched a new campaign, the AI didn't create all of that lift. If the team lost two reps, labor savings may look bigger than they really are.
A more rigorous approach starts with a baseline and a control group. Keep a subset of calls or leads on the human-only path, then compare outcomes against the AI-handled group. The measurement guide at AI voice agent ROI practical measurement recommends tracking a missed-call baseline before deployment, plus speed to lead, containment, escalation, and transfer success. It also points to incremental lift as the difference between the AI group conversion rate and the control group conversion rate.
A two-week pilot that finance can trust
Week one should establish the baseline and the routing rules. Week two should split traffic cleanly, preserve the control group, and record the same outcomes for both paths. That gives you a comparison that's far more credible than a simple “last month versus this month” story.
A CFO-ready report should show three things, the baseline, the control group, and the AI group. It should also explain what changed, what didn't, and which calls were excluded. If the pilot only contains the best-performing queue, the finance team will catch it.
Practical rule: if you can't explain the test design in two sentences, the ROI number isn't ready for budget review.
For teams that want a broader framework for ROI logic, the internal guide on how to calculate return on investment fits well here. The key point is simple, the measurement method matters as much as the model.
The strongest pilots don't just prove that AI answered calls. They prove that AI changed the business outcome in a way the human-only path didn't.
Running Sensitivity Analysis on Your Model
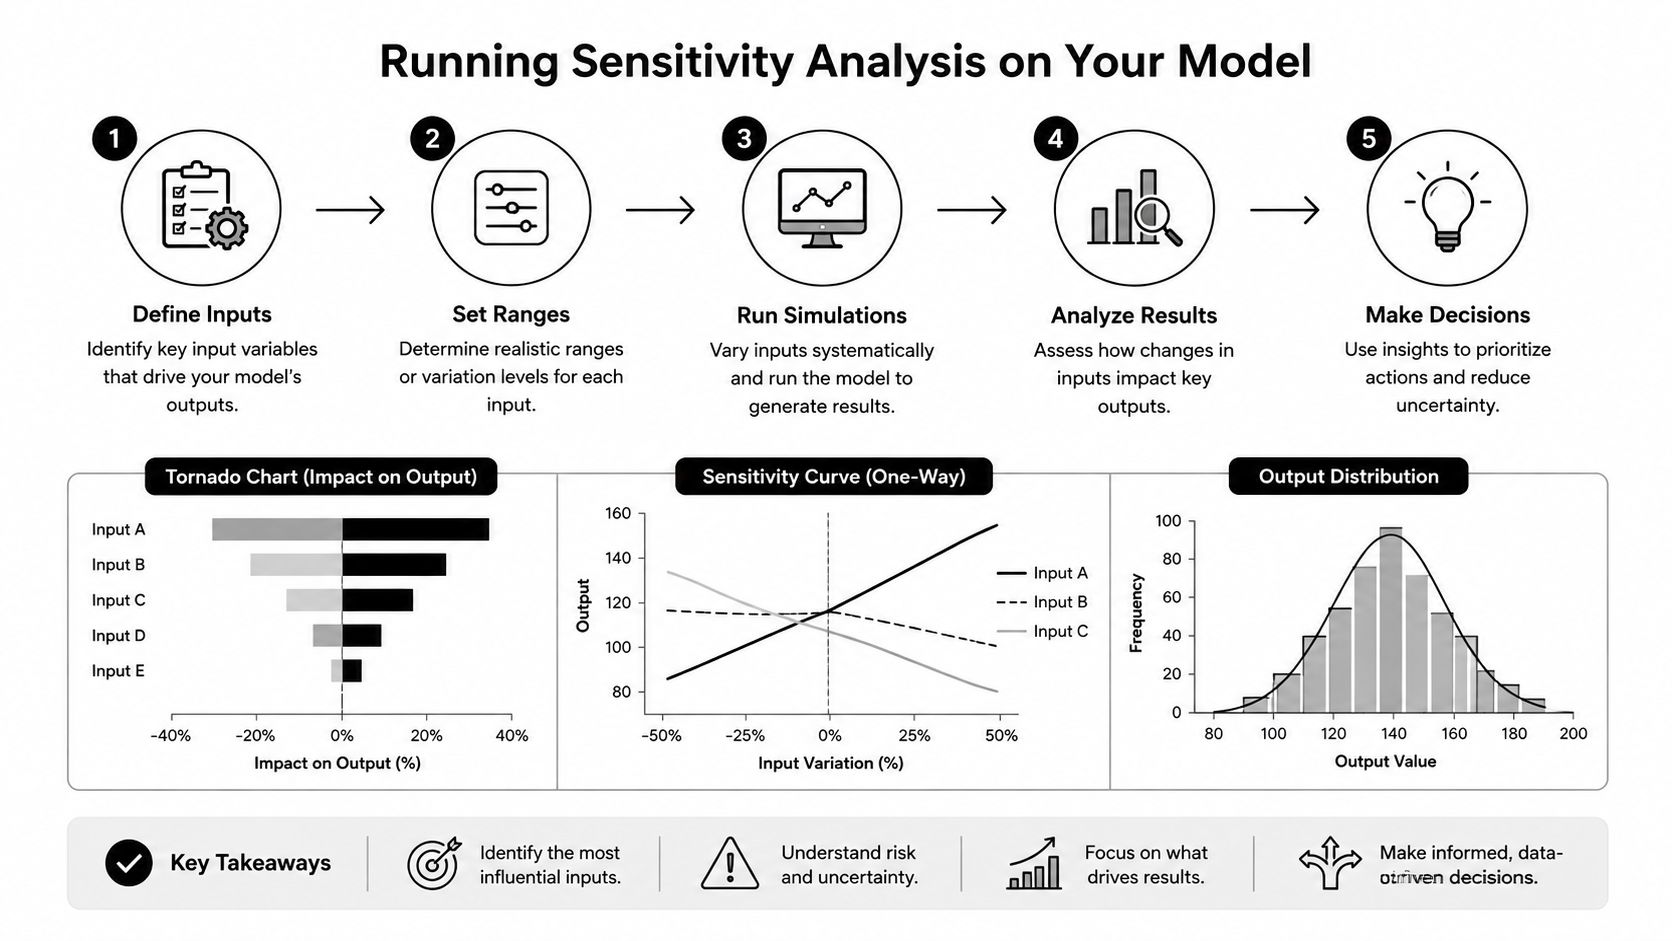
A single point estimate can make a bad model look clean. Sensitivity analysis is where the spreadsheet gets honest. Test the assumptions that move the outcome, then show leadership the range instead of only the best case.
Start with the two variables that usually matter most, call volume and AI cost per call. If monthly volume slips lower than expected, payback slows. If AI cost rises because the implementation needs more telephony, escalation logic, or QA than planned, the savings narrow faster than expected. Containment rate matters too, because every call the AI can't finish pushes work back to the human team.
The point isn't to create a perfect tornado chart. It's to identify where the model bends first. In most business cases, the conservative version is the one that deserves the most airtime, because it shows whether the project still works when the actual-world messiness shows up.
What to stress first
- Call volume: test lower, normal, and peak months.
- AI cost: include a realistic per-call range, not the vendor's prettiest number.
- Containment: model a weaker-case flow where more calls escalate.
- Handle time: extend it if real callers ask more than your sample suggests.
The most useful leadership view is a range, not a single line. If the project still pays back under conservative assumptions, it's probably worth piloting. If it only works in the best case, the model isn't broken, but the timing may be.
Present the conservative case first. If the upside is still attractive after that, you've got a real business case instead of a hope.
Implementation and Scaling Costs Most Calculators Miss
A voice agent can look cheap on paper and still land as a mediocre investment once it has to live inside a real operating stack. The cost model has to include telephony, routing, integrations, QA, and internal oversight, because those are the pieces that determine whether the savings hold up after launch. A calculator that skips those lines can still be useful, but it will not give a CFO a defensible payback view.
Telephony and carrier minutes are the first add-on that teams notice. Then comes integration work, especially if the agent needs CRM updates, calendar actions, or helpdesk logging. The cost is not just the build. Someone has to own failure handling, escalation rules, and ongoing edits when products, scripts, or policies change.
Prompt tuning and persona maintenance are easy to underestimate. Early pilots usually sound good on the demo path, then drift when callers use edge-case language or when the team changes the qualifying script. QA sampling matters for the same reason, because a voice agent that performs well in production still needs supervision, especially when transfers or lead qualification are part of the workflow. The operational lens for that work is the same one used in an AI outbound call agent rollout, where routing and review discipline shape the outcome.
The costs that erode ROI
- Telephony minutes: budget for conversation volume, not just software access.
- Integration build: CRM, calendar, and helpdesk connections take real engineering time.
- Escalation logic: define when the agent hands off, and who receives it.
- Prompt maintenance: update scripts when policies or offers change.
- QA and oversight: reserve internal time for call sampling and review.
- Vendor management: someone on your side has to own the relationship.
Scale cuts both ways. As volume rises, unit cost often becomes more attractive. Integration complexity can rise at the same time, because more queues, more edge cases, and more stakeholders enter the picture. A model that works for one queue can become messy when it is pushed across the whole organization.
The rollout itself should be staged. In the first 30 days, build the calculator and capture baseline metrics. In days 31 to 60, run the pilot with a control group and document the same outcomes on both paths. In days 61 to 90, commit, optimize, or walk away based on measured lift, not enthusiasm.
The first queue is the decision point. It tells you which CRM event to instrument, which handoff path needs the most attention, and how much internal review time the pilot will consume.
If the calculator still works after those costs are included, the business case is real. If it only works before implementation and scale are counted, the model is too optimistic for rollout.