
Marketing Automation Benefits: Metrics, Examples and ROI
Every dollar spent on marketing automation generated $5.44 over the first three years, with payback in under six months, according to a return estimate in Oracle's marketing automation statistics summary. That figure reframes the question. Marketing automation benefits aren't mainly about sending more email. They're about whether you can prove that faster, more consistent follow-up created pipeline, and whether your data is clean enough for anyone to believe the answer.
Marketing Automation Benefits at a Glance
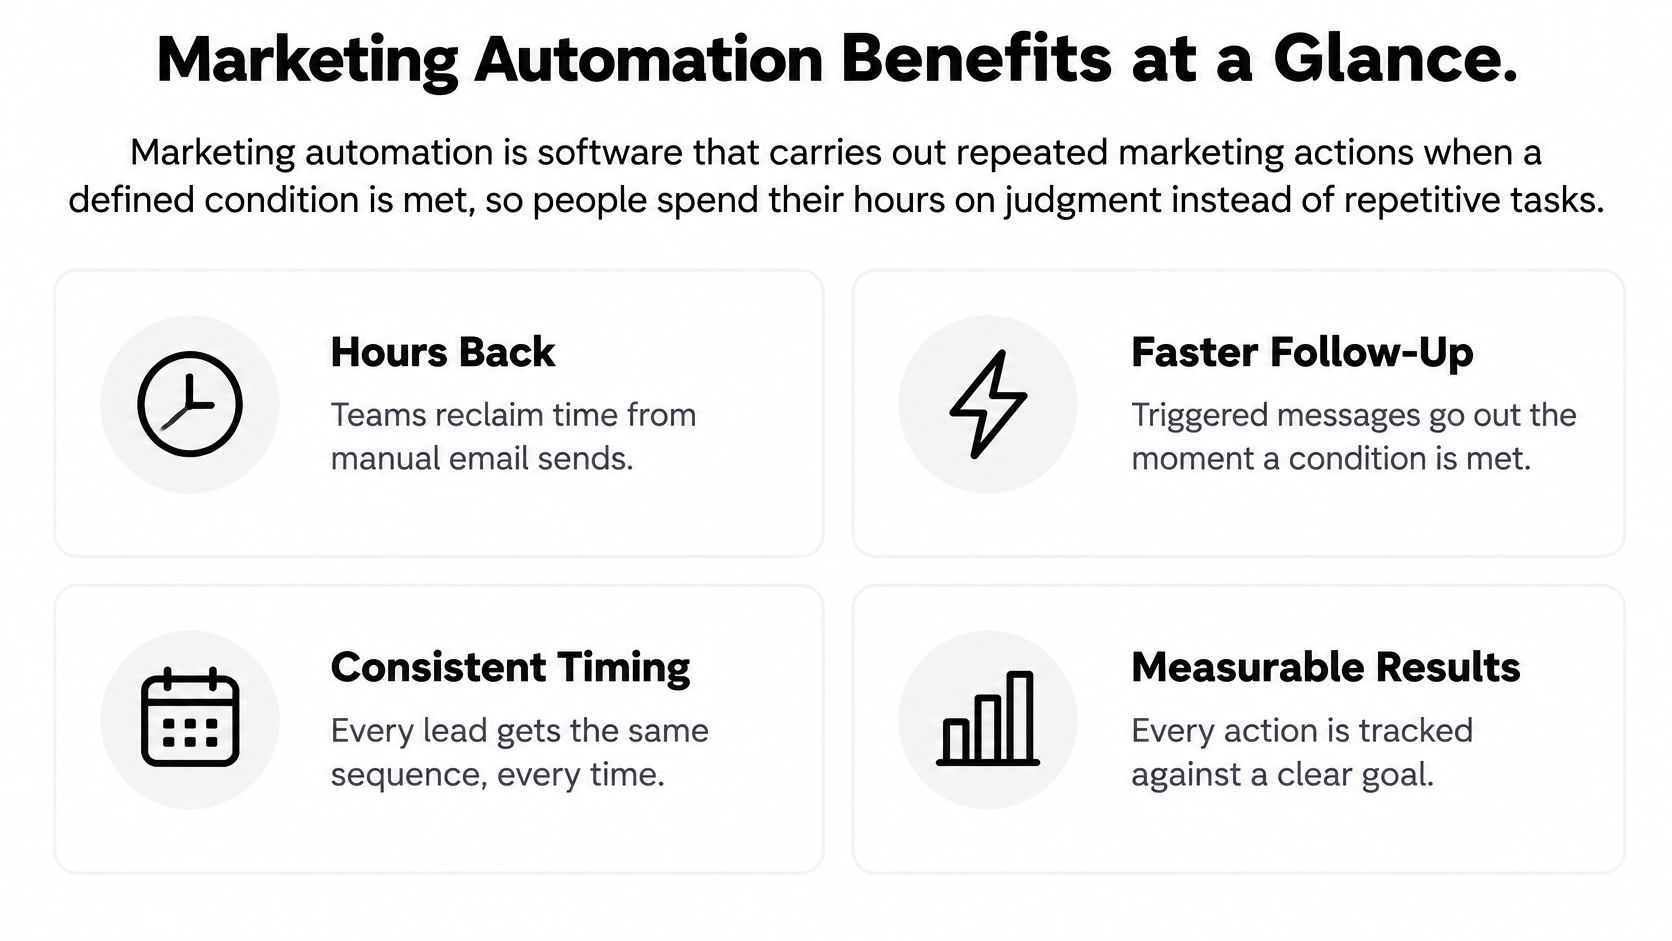
Marketing automation is software that carries out repeated marketing actions when a defined condition is met, so people spend their hours on judgment instead of repetitive tasks. The benefits readers search for fall into five areas: efficiency, lead scoring, personalization, pipeline acceleration and ROI.
The strongest evidence isn't limited to email. In German survey data collected between September 30 and December 7, 2022, the University of Hamburg 2023 Marketing Technology Report found automating relevant marketing areas could increase overall marketing performance by up to 58.2%. Automating an analytics process produced an average performance increase of 42.2%, the strongest reported result. That matters for B2B and SaaS teams because long sales cycles depend on scoring, segmentation, attribution and follow-up staying consistent across channels.
Reported Marketing Automation Benefits and What They Mean
| Benefit | Reported figure | Source | How to read it |
|---|---|---|---|
| Time saved per marketer | 13 hours per week (32.5% of a 40-hour week) | ActiveCampaign 2025 survey of 1,000 U.S. marketers | Self-reported by marketers using AI tools |
| Operating cost reduction | $4,739 per month per team | Forbes report on the ActiveCampaign study (2025) | Average for AI-powered systems; team size varies |
| Sales productivity | 14.5% increase | Oracle benchmark summary | Associated with automation, not proven causal |
| Higher conversion rates | About three-quarters of users | Oracle benchmark summary | Share reporting higher conversion after implementation |
| Overall marketing performance | Up to 58.2% | University of Hamburg 2023 report | Study finding when relevant areas are automated |
| Marketing analytics process | 42.2% average increase | University of Hamburg 2023 report | Strongest single result in the study |
| Return within six months | 44% reported a return (63% expected one) | Oracle benchmark summary | Benchmark; depends on data quality and process design |
On costs, the Forbes report on the ActiveCampaign study states AI-powered marketing systems reduced operating costs by an average of $4,739 per month per team.
Every row above is a benchmark from a specific study, not a guarantee for your funnel.
Find the row that matches your largest bottleneck. If leads wait hours for follow-up, productivity averages won't help you decide. If reporting eats the week, conversion claims are secondary. The headline number only becomes useful once you know which delay, inconsistency or blind spot you're trying to remove.
How Automation Turns Triggers Into Results
Automation works like a thermostat. You set the rule once, and the system acts whenever the room drops below the target. Nobody stands at the boiler waiting to notice.

Marketing has the same three parts. A trigger is a prospect opening the pricing page. A condition checks whether their score crosses a threshold or whether they sit in a target industry. An action sends a case-study email, creates a task for a rep or updates the CRM stage.
One Lead End to End
Say a VP of Operations downloads a guide on a Tuesday. The score rises, the nurture sequence starts within minutes, and the account owner gets an alert with the page history. If that alert runs through Slack and other connected tools, it's worth taking time to secure your Slack and Zapier connection so access and data flows don't become the weak point in an otherwise reliable handoff.
The CRM is the memory those rules read. A practical marketing automation workflow therefore produces benefits from only three sources:
- Removing waiting time: The response follows the signal in minutes, not at the next inbox check.
- Applying the same rule: Every record gets scored, routed and followed up the same way.
- Checking data at volume: The system reviews activity across every contact, which no human team can do daily.
That mechanism also sets the limit. Automation is only as good as the rules and data behind it. A wrong threshold, stale field or missing owner doesn't create a small error. It repeats that error for every lead until someone notices.
Time Savings Across the Marketing Team
The hours usually hide in work nobody calls marketing. Lead assignment, follow-up reminders, CRM field updates, list building, deduplication, asset distribution and the weekly report assembled from several dashboards all consume focused time in small pieces.
In a 2025 survey of 1,000 U.S.-based marketing professionals and business owners conducted by Talker Research, the ActiveCampaign research found marketers using AI saved an average of 13 hours per week, equivalent to 32.5% of a 40-hour workweek.
Do the arithmetic. That's about 676 hours per marketer over 52 weeks, roughly four working months. For a team, our marketing agency case points in the same direction. A typical mid-sized agency saves 20-40 hours per week of manual work and sees a 20-30% improvement in lead conversion.
The Reallocation Test
Saved hours don't create value by disappearing into more meetings. They matter when a team moves them to analysis, testing, offer development or sales conversations. In that agency case, account managers spent 80% of their time on strategy after automation, up from spending 60% of their time on administrative tasks. That shift, not the raw hour count, is the benefit.
Reallocation test: If you can't name where the saved hours went, you haven't captured a time benefit yet.
Two cases break the pattern. A solo marketer with low lead volume may not generate enough repetitive work to justify building and maintaining complex workflows. A team with undocumented processes has the opposite problem. It doesn't remove confusion, it automates confusion faster, and then spends the saved time untangling exceptions.
Ask three questions each month:
- Where did the hours go: Which analysis, test or customer conversation replaced the manual task?
- Who reviewed the output: Who checks that automated updates, lists and reports are still correct?
- Which metric changed: Did a conversion, response-time or pipeline measure move after the reallocation?
If those answers stay vague, treat time savings as capacity, not ROI. Capacity becomes valuable only when a manager assigns it to work that customers or prospects can feel.
Lead Scoring and Faster Pipeline Movement
Lead scoring has two parts. Fit covers company size, role and industry. Behavior covers pricing page visits, webinar attendance and repeat email clicks. Negative points handle disengagement, such as long inactivity, so old interest doesn't keep a cold lead at the top of a rep's list.
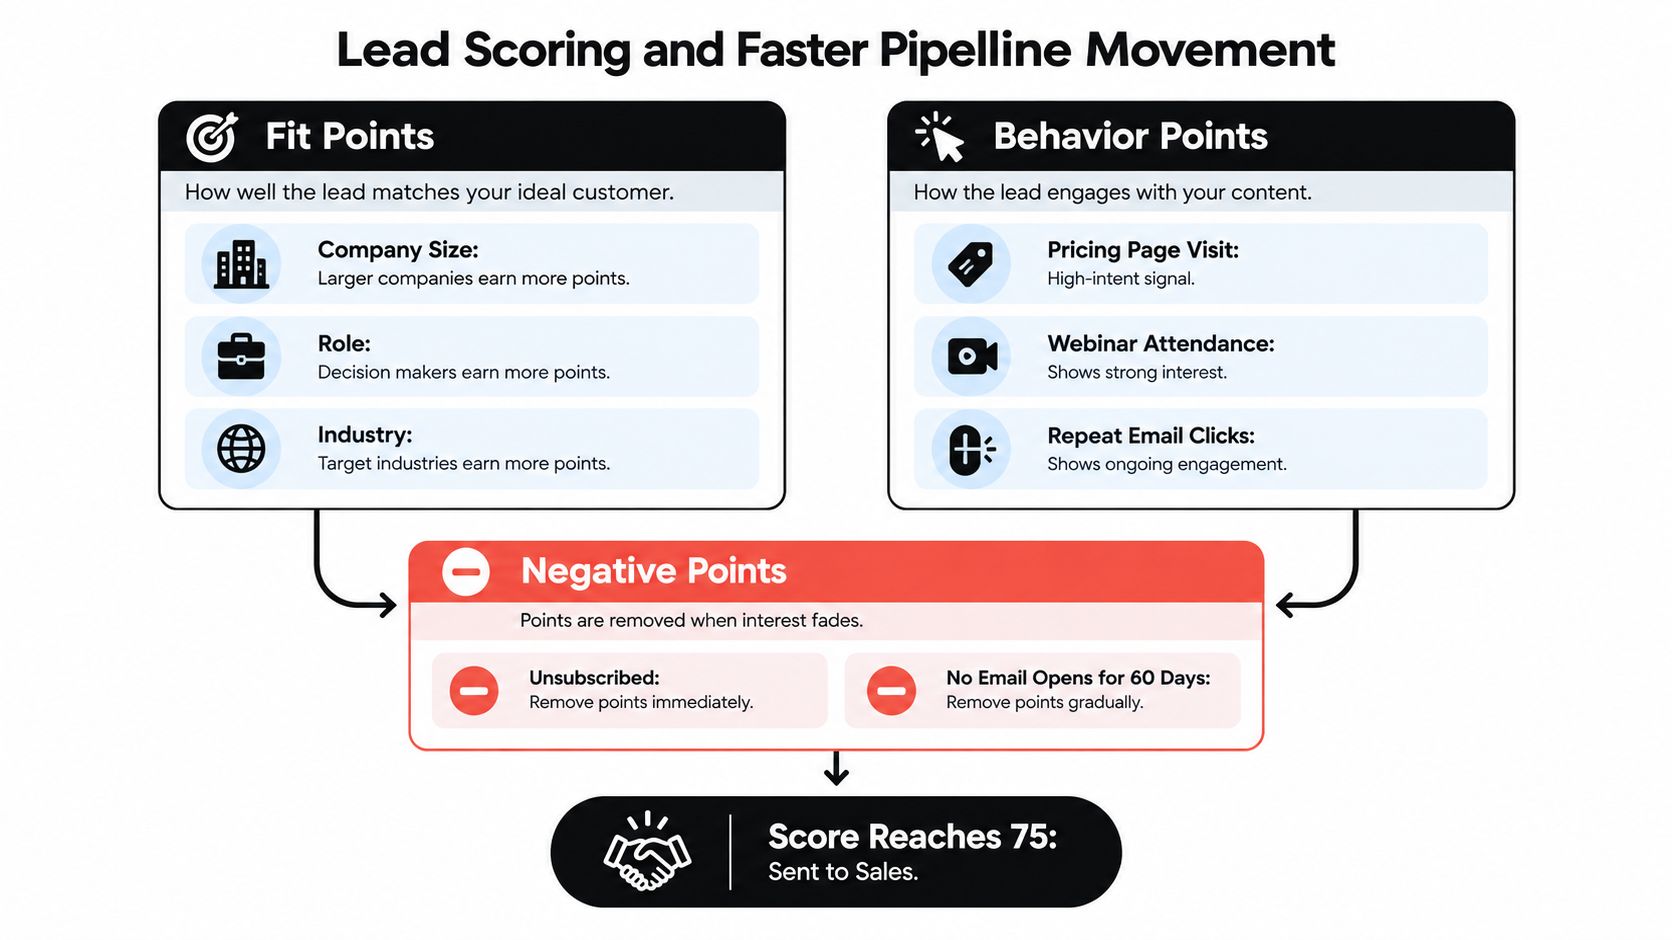
The flow should stay simple. Capture every inquiry, score it against fit and behavior, then nurture it or route it to a rep. Speed matters because the alert carries context the rep would otherwise spend the first call collecting.
In our marketing agency case, which is an agency result rather than a SaaS benchmark, the agency had 12 employees and a 4-hour average lead response time before automation. Afterward it reached a 100% lead capture rate and a 40% increase in qualified appointments. That illustrates capture and routing discipline. It doesn't prove every SaaS team will see the same lift.
The video below walks through how scoring and routing rules connect in practice.
Where Nurturing Helps and Where It Doesn't
A 2025 Journal of Marketing study combining interviews with three quantitative studies found automated lead nurturing increased lead-conversion probability by between 0 and 23 percentage points, depending on context. The strongest effect occurred when buyers were new prospects, sales cycles were shorter and expected deal values were smaller. Effects were weaker or negligible in long, relationship-driven, high-value sales.
That range is more useful than a single average. A practical guide to lead scoring best practices should therefore push high-intent, low-uncertainty leads into automated qualification and early nurture, while handing complex enterprise opportunities to a person when conversation adds value. It's also why measuring qualified leads against pipeline impact matters more than celebrating a larger MQL count.
Practical rule: Automate information gathering and qualification. Hand over when judgment, politics or multi-stakeholder uncertainty becomes the work.
Measure lead-to-meeting and meeting-to-opportunity conversion separately by segment. A blended rate can hide the exact pattern the study found, strong gains in smaller deals masking no gain at all in enterprise accounts.
Personalization With Human Checkpoints
More automation doesn't automatically mean better personalization. It means more messages can carry data. Whether that data feels relevant or intrusive depends on the level you use and the checkpoint you keep.
Field-level personalization inserts a first name, company or industry. It's cheap and useful for clarity, but it doesn't prove you understand the buyer. Segment-level personalization matches content to a role or buying stage, so an operations director and a founder don't receive the same proof. Behavior-level personalization changes the next message based on what the prospect did, which is where relevance rises and where a wrong inference becomes most visible.
The trust evidence should slow teams down. The Ascend2 2025 study on the evolution of AI in marketing found privacy and compliance were the leading AI-adoption obstacle for 37% of marketers, 54% feared loss of creativity and human touch, and only 13% fully trusted AI. The same source reports 88% of consumers expect responsible and secure handling of personal data, but only 49% of organizations meet that expectation, and that emphasizing AI in marketing messages could reduce engagement and trust while emphasizing human expertise produced more favorable responses.
That's the context for how human oversight improves AI output and for a disciplined approach to personalization at scale. You don't need a person approving every send. You need approval where tone, consent, price or reputation can go wrong.
Automate or Keep a Human Checkpoint by Activity
| Activity | Automate | Keep a human checkpoint |
|---|---|---|
| First-touch outbound email | Draft, sequence and send from segment data | Approve templates and sample personalized lines before launch |
| Lead scoring and routing | Score behavior and firmographics, route to the owner | Review high-value and strategic accounts before routing |
| Pricing and contract talks | Share pricing page and booking links | Sales-led conversation, always human |
| Recruitment messages | Scheduling, reminders and status updates | Personal outreach and candidate replies reviewed by a person |
| Voice AI calls | Inbound triage and meeting booking | Escalation on complaints, objections or opt-out requests |
| Customer data use | Segmenting on consented fields | Privacy review before any new data source is added |
Automation raises scale and consistency. People protect relevance, compliance and reputation. Every outbound channel, including voice AI calls, needs an approval threshold, a log of what was sent or said, and an escalation path a prospect can reach.
Prove ROI Against a Baseline Before You Trust It
ROI is a measurement problem before it's a software result. If your CRM fields are unreliable, automation will act confidently on bad information, and your reports will describe that activity with impressive precision. Neither proves revenue impact.
The Supermetrics 2025 Marketing Data Report announcement reports marketers are managing 230% more data than in 2020, while 56% lack enough time to analyze it, 38% struggle with integration and reporting tools, and 41% cite cross-channel ROI measurement as a barrier. It also reports 56% of marketers identify poor data quality, 46% data fragmentation, and 42% incomplete customer-journey mapping as obstacles to understanding audiences.
Those aren't abstract data complaints. They describe the exact inputs your workflows will read.
Two Failure Cases Worth Picturing Clearly
Say an industry field is wrong and a manufacturing lead enters a SaaS sequence. The emails arrive on time, the opens get tracked, and the workflow looks productive. The prospect, meanwhile, receives proof that you don't know who they are.
Or say account ownership is wrong and an enterprise account routes to a junior rep. Response time improves on your dashboard. The account gets a faster, weaker first conversation. In both cases, automation reduced delay while reducing quality, which is why activity metrics can't stand in for pipeline metrics.
What the Benchmark Actually Says
A Nucleus Research review of 16 marketing-automation ROI case studies reported an average return of $5.44 in benefits for every $1 invested over the first three years, with payback in under six months. It attributed value to higher marketer productivity, more efficient campaigns, automation-related cost savings, simplified infrastructure and improved prospect engagement. It also makes the result conditional on data quality, segmentation, deliverability, CRM integration and measurement design.
Read that carefully. Productivity, campaign output and engagement are drivers. They aren't the same thing as closed revenue. A team can produce more campaigns, win more opens and still create no additional qualified pipeline if targeting, offer or sales follow-up is weak.
We state that most of our clients see a 5-10x return within the first year of automation. Hold that claim to the same standard as any vendor claim. Ask what counts as return, which baseline it uses, and whether the calculation includes implementation and operating time.
Benchmarks and the Funnel Metric to Track for Each
| Funnel stage or driver | Reported benchmark | Metric to track in your funnel |
|---|---|---|
| Subscriber acquisition | 361% increase in new subscribers | New subscribers per month from automated forms and offers |
| Engagement | 32% increase in email open rates | Open and click rates by segment, not blended totals |
| Lead generation | 225% increase in lead generation | Marketing-qualified leads created per month |
| Campaign output | 54% more campaigns produced | Campaigns shipped per quarter against team hours |
| Revenue return | $5.44 per $1 over three years; payback under six months | Pipeline and closed revenue minus automation operating cost |
Those operational benchmarks come from the same Nucleus review. Use them as hypotheses for your funnel, not as targets to paste into a board deck. A 225% increase in lead generation means little if sales accepts none of the extra leads. A 54% increase in campaigns produced can even hurt if the additional campaigns lower relevance.
Define ROI So Productivity Can't Masquerade as Pipeline
Use one definition and keep it stable:
ROI = (attributable pipeline and revenue minus automation operating cost) divided by automation operating cost.
Operating cost includes software, implementation, data cleaning, content production for sequences and the staff time spent maintaining workflows. If you leave maintenance out, you'll overstate return in exactly the area automation vendors prefer you to ignore.
Track productivity separately. Hours saved, campaigns shipped and response time belong in an efficiency report. Subscriber acquisition, engagement, marketing-qualified lead creation, sales acceptance, opportunity creation and revenue belong in the funnel report. Every automation we implement includes tracking and reporting that shows how much time and money is saved, but time and money saved still need a pipeline test beside them.
The Five-Step Baseline Procedure
- Record baseline conversion rates for two to three months before launch. Capture lead-to-meeting, meeting-to-opportunity, sales acceptance and response time by segment. Without a pre-period, seasonality and channel mix will happily take credit for your workflow.
- Write lifecycle-stage ownership between marketing and sales. Define who owns a new lead, a marketing-qualified lead, a sales-accepted lead and a recycled lead. If ownership is disputed, attribution will be disputed too.
- Clean the CRM fields that trigger workflows, then check them monthly. Start with industry, company size, role, owner, consent status and lifecycle stage. Our CRM automation includes automated lead scoring, smart segmentation, behavior-triggered campaigns and predictive analytics, and every one of those functions reads fields like these.
- Launch one workflow with a holdout group that receives no automation. Keep the holdout similar in source, segment and intent. This is how you separate automation impact from a better month, a new ad campaign or a rep who suddenly follows up faster.
- Compare cohorts after 90 days, not blended totals. Compare automated and holdout groups within the same segment and period, then check seasonality and channel-mix effects before you claim a lift.
Ninety days won't settle a long enterprise cycle, and you shouldn't pretend it does. It will show whether response time, meeting creation and sales acceptance moved for comparable leads. For longer cycles, keep the cohort labels in the CRM so opportunity and revenue can be read later without reconstructing history from memory.
What to Build First
Start with the one workflow that has the clearest baseline and the shortest feedback loop. For many B2B and SaaS teams, that's new-lead capture, scoring and routing, because response time and meeting rate are visible quickly. Don't start with a sprawling nurture library that touches every segment. You'll create activity everywhere and evidence nowhere.
A 5x claim without a baseline and a holdout isn't evidence. It's arithmetic waiting for an audience. Once one workflow proves it can move a funnel metric for comparable leads, expand it, document the fields it depends on, and apply the same test to the next bottleneck.
If you want marketing automation benefits you can defend in a revenue meeting, start with one workflow, a clean baseline and reporting that separates hours saved from pipeline created. MakeAutomation builds CRM automation, lead scoring, behavior-triggered campaigns and tracking for B2B and SaaS teams, so book a visit to map your first measurable workflow before you automate the rest.