Lead Generation KPI: 8 Metrics That Matter Most in 2026
Many teams don't have a measurement problem. They have a dashboard problem. Twenty metrics, three definitions for a qualified lead, and nobody can explain why pipeline fell last month. Adding more charts won't fix that. It usually hides the four or five numbers that would have told you where revenue leaked.
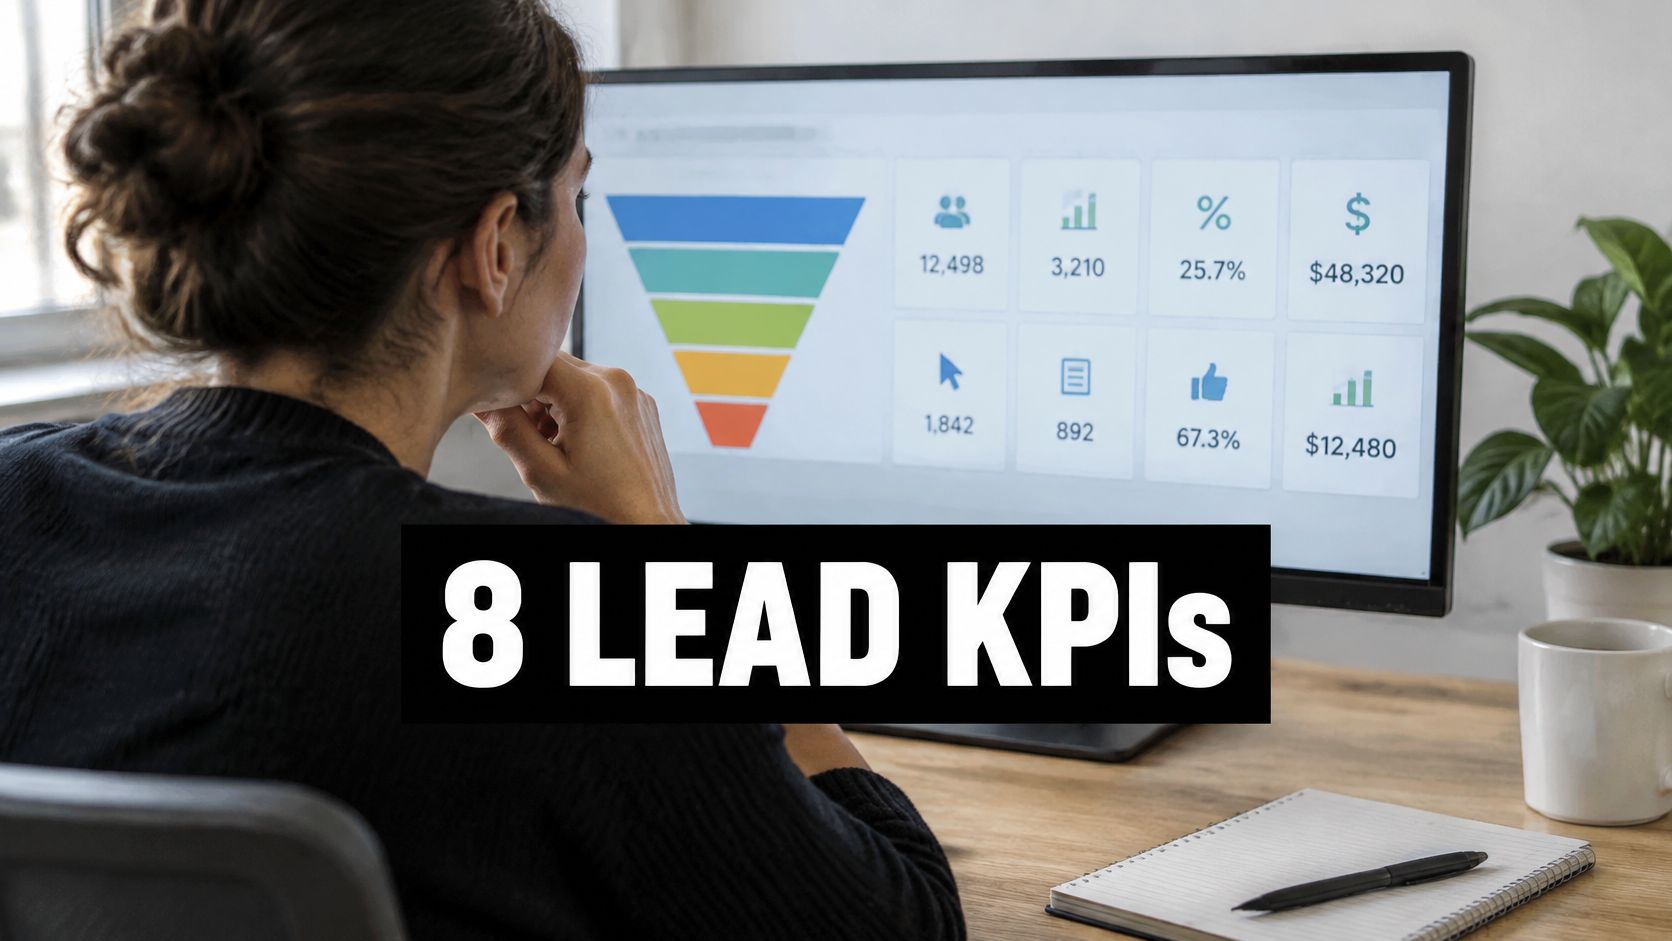
I recommend the opposite approach. Track one lead generation KPI per funnel stage, in order, and force every number to earn its place by triggering a decision. The eight below run from first visit to closed revenue. Each one states its stage, whether it's leading (moves before revenue does) or lagging (confirms what already happened), plus the formula, what it reveals, its blind spot, and how to track it in a CRM without spreadsheet archaeology.
That shift away from volume is already happening. In a statistically tested 2024 benchmark of 1,048 B2B marketers, only 49.0% measured "leads produced," down from 63.6% in 2023, according to the 6sense 2025 B2B Marketing Attribution and Contribution Benchmark. Mature teams are replacing raw counts with lifecycle conversion, opportunity creation, and revenue. That's the right direction. Your job is to make those definitions consistent enough that automation improves outcomes, not just reported lead counts.
1. Visitor-to-Lead Conversion Rate
Funnel stage: Awareness to capture. Indicator type: Leading.
A high visitor-to-lead rate can still produce weak pipeline. Track the percentage of unique visitors who submit a form, book a call, start a trial, or use chat to create a contact: (leads generated / unique visitors) × 100. Calculate it by landing page and traffic source. A blended sitewide rate hides which offers attract the right prospects.
The 2024 median landing-page conversion rate across industries was 6.6%, according to Unbounce's Conversion Benchmark Report covering July 2023 through July 2024. Treat it as context, not a target. A demo page and an ebook page serve different intents, so compare like with like and check whether conversions progress to qualified leads.

How to track it without fooling yourself
Set a baseline for each page before sending paid traffic. Then test one change at a time, such as the headline, offer, or form length. If a shorter demo form raises conversion, check whether the lead-to-MQL rate holds before scaling the change. More contacts are useful only if lead quality stays intact.
- Cut fields hard: Ask only for information needed at this stage. Collect more through progressive profiling on later touches.
- Segment by source: Compare LinkedIn ads and Google search traffic on the same page before shifting budget.
- Add capture paths: Chat can turn a visitor's question into a contact. SignalZen's guide to ecommerce chatbots explains how conversational capture works.
Some buyers research through AI answers and peer communities, then arrive through direct traffic. If direct conversions rise, add a self-reported attribution question rather than assuming the homepage caused the change.
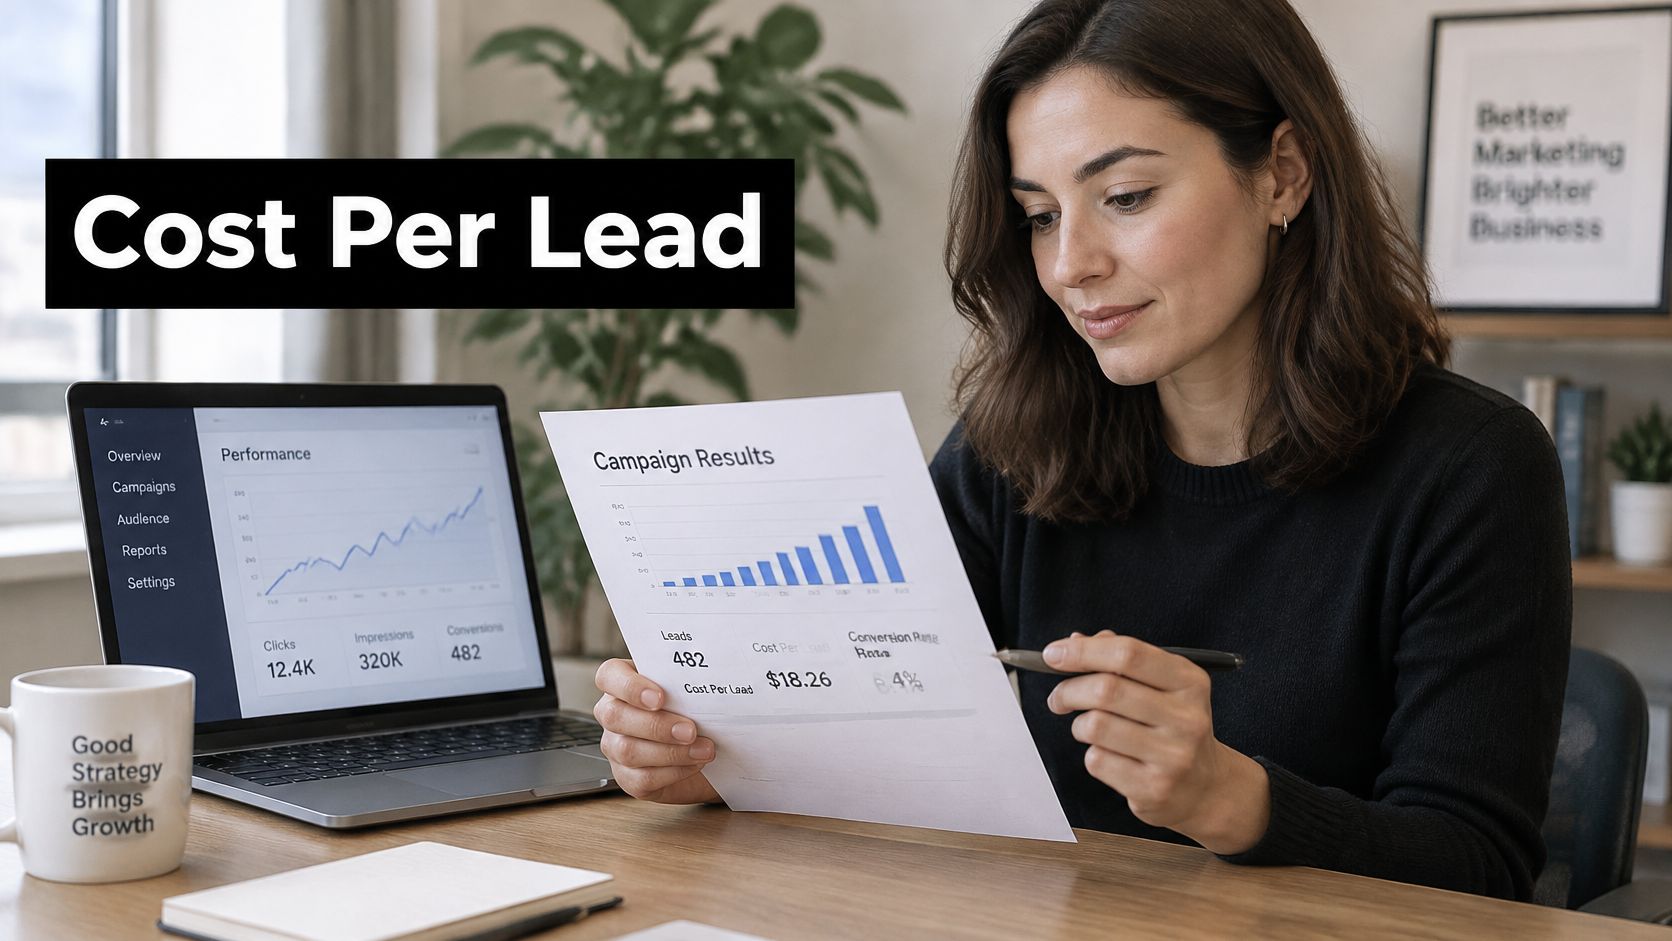
2. Cost Per Lead (CPL)
A low CPL can hide an expensive acquisition channel. Funnel stage: Acquisition. Indicator type: Leading, because it measures the cost of generating leads before their quality or revenue is known.
Calculate CPL as campaign or channel spend divided by leads generated in the same period. Compare channels using consistent spend and lead definitions. Broadening targeting may lower CPL while bringing in fewer suitable prospects, so use the metric to spot cost changes, not to make budget decisions alone.
Set a maximum affordable CPL using average deal value and lead-to-customer conversion rate. Tracking lead generation cost per lead against downstream conversion helps connect acquisition spend to the eventual business outcome.
The version that actually helps
Track cost per qualified lead beside CPL. For example, a webinar may produce leads at half the cost of a trade show, but if far fewer webinar leads become customers, the lower CPL may not mean better economics. Review both costs alongside the same downstream conversion window.
Keep ad spend and lead records aligned between advertising platforms and your CRM. Otherwise, CPL becomes a manual estimate that is hard to compare. Review it on a consistent schedule rather than reacting to daily fluctuations. For paid social, study approaches to getting better leads with Rapid Ads before deciding that the channel itself is unprofitable.
3. Lead-to-MQL Rate

A campaign can generate plenty of leads and still send few qualified prospects toward sales. Lead-to-MQL rate measures the share of leads that meet marketing's qualification criteria: (MQLs / total leads) × 100.
Funnel stage: Marketing qualification. Indicator type: Leading. It helps show whether lead fit and engagement criteria are identifying prospects who are ready for further attention. See how qualification fits into the lead generation funnel.
The result depends on a clear MQL definition. Agree on the criteria with sales, then represent them in CRM fields, such as firmographic fit, role, and engagement signals. If the rules are unclear or change without notice, the rate becomes difficult to compare over time.
Where this breaks in practice
Scoring models can lose relevance as buying patterns change. Review thresholds against closed-won records and check which recorded signals appear on successful deals. For example, a team may find that visits to case study pages help distinguish stronger prospects from casual content readers. A team attracting broad job titles may need to give decision-maker roles more weight.
Practical rule: A rep should be able to see why a lead qualified by reviewing a few fields on the CRM record. If the reason is hard to identify, simplify the scoring criteria.
A lead-level score can also miss buying activity across an account. Individual contacts from an account with few engaged stakeholders may not represent a sales-ready opportunity, particularly in complex B2B deals. Segment the rate by source and account to see whether qualification is producing promising contacts or broader buying-group engagement.
4. MQL-to-SQL Rate (Sales Qualified Lead Rate)
Funnel stage: Handoff between marketing and sales. Indicator type: Leading for pipeline, lagging for marketing quality.
The formula is (SQLs / MQLs) x 100. This is the most political number on the list because it grades both teams at once. A low rate means marketing's MQL definition is too loose, sales follow-up is too slow, or both. You can't tell which until you instrument the handoff properly.
For a reference point, in 2024 the median SaaS lead-to-SQL conversion rate was 28%, with the top quartile beginning at 42%, according to ConversionBench's benchmark citing HubSpot's State of Marketing 2024. Note that this is lead-to-SQL across the full top of funnel, so your MQL-to-SQL rate should sit well above it. If it doesn't, your MQL stage is adding a label, not information.
Make rejection data mandatory
Every disqualified MQL needs a rejection reason code before the rep can close the task. Wrong fit, no budget, no response, bad timing, duplicate. Without that field, your weekly review becomes two teams trading opinions. With it, patterns show up fast. Say webinar MQLs convert to SQLs at twice the rate of content download MQLs. Reweight the scores so a download alone can't trigger handoff.
- Set an SLA: Define how quickly sales must work a new MQL and report breaches weekly, by rep.
- Split inbound and outbound: Blending them hides which motion is failing.
- Automate routing: Assign by territory, account owner, and availability the moment the MQL fires, and log the outcome on the same record.
Track the timestamps, too. MQL date and SQL date as immutable CRM fields let you measure time in stage, which is often where the problem sits.
5. Speed to Lead
Funnel stage: First response, immediately after capture. Indicator type: Leading, and the most actionable one here.
Speed to lead is the time from the lead-created timestamp to the first meaningful two-way interaction. Not an email queued. Not an autoresponder. An actual attempt a prospect can respond to. Measure it in minutes, report the median, and track the percentage contacted within five minutes and within one hour.
The evidence on this is not subtle. A 2011 Harvard Business Review study by James Oldroyd, Kristina McElheran, and David Elkington examined 1.25 million sales leads received by 29 B2B and B2C companies and found companies attempting contact within 60 minutes were nearly 7 times more likely to qualify the lead than those waiting at least one additional hour, as detailed in Vida's summary of the speed-to-lead research. An aggregated benchmark goes further, reporting leads contacted within five minutes are 21 times more likely to qualify than leads contacted after 30 minutes, according to the LeadSpot benchmarks documentation.
This short walkthrough shows how instant response workflows get wired in practice.
Fix the process, not the reps
Slow response is almost never a motivation problem. It's routing delays, unclear ownership, duplicates, and leads arriving at 9 p.m. with no coverage. Fix it with event-driven routing and lead generation marketing automation that responds the moment a form fires, including instant SMS or email as a holding response and AI voice agents that can call within seconds and book directly onto rep calendars.
If your current routing tool is the bottleneck, compare lead routing alternatives to Chili Piper before adding headcount. Segment speed by source, form, geography, and business hours. A strong median can hide a broken weekend queue where your best-fit leads sit untouched until Monday.
6. Lead Velocity Rate (LVR)
Funnel stage: Qualified-lead generation, at the top of the funnel. Indicator type: Leading. LVR tracks whether the pool of sales-ready demand is growing before that change shows up in revenue.
Calculate month-over-month LVR as ((current period qualified leads − prior period qualified leads) / prior period qualified leads) × 100. Count leads using a consistent qualification definition in both periods. Raw lead volume can rise while qualified volume stays flat, so keep the metric tied to the CRM qualification field rather than form fills.

LVR can swing sharply when qualified-lead volume is low. In June 2023, B2C companies generated a median of 196.5 new leads, compared with 27 for B2B companies, according to Databox benchmark data published in its 2025 lead-generation statistics report. Use a rolling average to make the trend easier to read, and annotate changes to qualification rules on the chart.
Reading a decline correctly
If LVR falls for two months, trace the change through the funnel before adjusting spend. Check visitor-to-lead conversion for a capture issue, lead-to-MQL rate for a qualification issue, and qualified lead volume by channel for a delivery issue, such as a campaign that stopped running. LVR signals a slowdown; the stage metrics help locate it.
A flat LVR alongside rising raw lead volume usually means the extra records are not improving qualified demand. Use the trend to inform capacity decisions, then confirm the pipeline can support any hiring change. Keep the calculation in a live CRM dashboard so the review uses current, consistently defined data.
7. Lead Source ROI
Funnel stage: Full funnel, by channel. Indicator type: Lagging.
The formula is ((attributed revenue − source cost) / source cost) × 100. A low-volume source with a high close rate, such as referrals, can outperform a high-volume paid channel that fills the CRM with leads sales ignores.
Start with a side-by-side first-touch and last-touch comparison. If content appears often as the first touch and paid search gets last-touch credit on the same deals, cutting content could starve paid search of future demand. Add a multi-touch model only after your source data is clean. Often, it is not.
Data hygiene before models
- Standardize the source field: Use a locked dropdown instead of free text, and add UTM parameters to every campaign link.
- Flag incomplete records: Report weekly on leads missing a source, owner, qualification status, or disqualification reason.
- Match the review cycle to your sales cycle: Judging a channel after 30 days when deals take six months can lead to bad budget decisions.
Track email separately rather than folding it into “other.” In 2025, 88% of businesses reported using email for lead generation, according to Dux-Soup's B2B Lead Generation Report 2025. The useful comparison is how well your CRM connects closed-won revenue to campaigns that sourced or influenced the deal. Make that connection at the account level to avoid counting the same pipeline multiple times.
8. Lead-to-Customer Conversion Rate
Funnel stage: End to end, capture to closed-won. Indicator type: Lagging. This is the verdict on everything above it.
The formula is (new customers / total leads in the same cohort) x 100. The word cohort does the heavy lifting. Dividing this month's customers by this month's leads mixes deals that started two quarters ago with leads created last week. Group leads by creation month, apply a fixed conversion window such as 90 or 180 days, and measure each cohort at the same age.
What cohort analysis reveals
Say a SaaS company runs cohorts by industry vertical and finds one segment converts at more than twice its average rate. That's a targeting decision handed to you on a plate. Shift budget, build segment-specific pages, and adjust scoring so fit in that vertical counts for more. You'll never see that pattern in a blended monthly rate.
This metric also anchors your economics. Pair it with customer acquisition cost and payback period and you can state plainly whether paid acquisition makes money. A startup that confirms its cohort conversion supports its CAC can scale spend with confidence. One that's guessing will find out from its bank account.
The test I use: If lifecycle stages in your CRM aren't updated by workflow, they're updated by memory, and memory loses. Automate stage changes off real events, form submits, meetings held, opportunities created, deals closed.
The blind spot is time. Because this number lags, it can't steer weekly decisions. That's fine. Its job is to validate or indict the leading indicators above it. If your MQL rate improves for two quarters and cohort conversion doesn't move, your MQL definition improved on paper only.
8 Lead Generation KPIs at a Glance
| Item | Funnel Stage | Type (Leading/Lagging) | Core Formula |
|---|---|---|---|
| Visitor-to-Lead Conversion Rate | Visitor to lead | Leading | Leads generated / unique visitors × 100 |
| Cost Per Lead (CPL) | Lead acquisition | Leading | Campaign or channel spend / leads generated |
| Lead-to-MQL Rate | Lead qualification | Leading | MQLs / total leads × 100 |
| MQL-to-SQL Rate (Sales Qualified Lead Rate) | Sales qualification | Leading | SQLs / MQLs × 100 |
| Speed to Lead | Lead response | Leading | Time from inquiry to first response |
| Lead Velocity Rate (LVR) | Qualified pipeline growth | Leading | (Current qualified leads − prior qualified leads) / prior qualified leads × 100 |
| Lead Source ROI | Channel performance and revenue attribution | Lagging | (Attributed revenue − source cost) / source cost × 100 |
| Lead-to-Customer Conversion Rate | Customer conversion | Lagging | New customers / total leads × 100 |
Turn These 8 KPIs Into a Dashboard That Runs Itself
Start smaller than you want to. Pick one KPI per funnel stage, set a target for each, and write down the exact CRM fields and timestamps behind every formula. Visitor-to-lead rate for capture, CPL and cost per qualified lead for efficiency, lead-to-MQL and MQL-to-SQL for qualification quality, speed to lead for response operations, LVR for momentum, source ROI and lead-to-customer rate for revenue truth. That's a complete system. Everything else is diagnostic detail you pull when one of those eight moves.
Define the lifecycle stages before you build anything. Lead, MQL, SQL, opportunity, and customer need entry criteria, exit criteria, and an owner for each transition. Stamp every stage change with a date field that workflows set automatically and reps can't overwrite. Add mandatory fields at the moments they matter, source at creation, rejection reason at disqualification, and close reason at deal end. Without those three fields, half the KPIs in this article degrade into estimates.
Then wire the data flow so nobody touches a spreadsheet. Ad platforms sync spend and campaign IDs into the CRM daily. Forms, chat, and voice calls create contacts with source and account matching handled at creation, including duplicate suppression. Scoring runs in real time, routing assigns an owner instantly, and alerts fire when an MQL sits untouched past your SLA. Dashboards refresh from the CRM itself, segmented by source, campaign, segment, and account, so a change in traffic quality doesn't masquerade as a change in team performance.
Manual tracking is where measurement programs die. The first busy month, someone skips the export, the numbers go stale, and the team stops trusting the dashboard entirely. Automation isn't a nice layer on top of this KPI system. It's the thing that keeps the data honest enough to act on, especially for speed to lead, where a workflow that responds in seconds beats a rep checking a shared inbox every hour.
This is the work we do at MakeAutomation. We build instant lead response that reaches every inquiry within 60 seconds, 24/7, automated lead scoring and routing, and CRM integrations across HubSpot, Salesforce, Pipedrive, and GoHighLevel, so the eight numbers above update themselves. In one B2B SaaS engagement, qualified lead volume rose 340%, sales admin time fell 68%, and the client recorded $1.2M in additional attributed revenue within six months of implementation.
If your dashboard has twenty metrics and no clear answer for where pipeline leaks, that's fixable in weeks, not quarters. Book the free 15-minute discovery call and we'll map which of these KPIs your funnel is currently failing, which definitions need to be rebuilt, and where automated tracking and response will recover revenue first.
If your funnel is losing qualified leads to slow follow-up and messy CRM data, MakeAutomation can rebuild the plumbing behind these eight KPIs, from 60-second lead response and predictive scoring to dashboards that update themselves across your existing stack. Visit the site to book your free 15-minute discovery call and get a concrete map of which metrics to fix first and how to automate them.