Lead Generation Cost Per Lead: Complete Guide
In 2024, the average cost per lead through Google Ads was $66.69 across more than 16,000 U.S. campaigns, but for B2B and SaaS companies, the meaningful benchmark is typically between $40 and $650, depending on how leads are qualified. The cheaper number isn't automatically better, because a low-cost contact can become an expensive sales distraction if it never reaches an opportunity stage.
A raw form submission tells you what your advertising bought. It doesn't tell you what your business can sell. That distinction explains why one campaign with a higher lead generation cost per lead can produce more revenue than another campaign that appears efficient at the top of the funnel.
For B2B and SaaS teams, the useful question is therefore not, “How cheaply can we collect contact details?” It is, “What does it cost to create a qualified opportunity and acquire a customer?” The answer requires tighter definitions, stage-by-stage measurement, and a willingness to reject attractive but commercially weak CPL figures.
Why Your Lead Generation Cost Per Lead Metric Is Misleading
In 2024, Google Ads produced an average cost per lead of $66.69 across more than 16,000 U.S.-based advertising campaigns, according to WordStream's Google Ads benchmarks. That figure sounds precise, but it becomes far less useful when you examine the categories behind it.
Business Services averaged $105.64 per lead, while Career & Employment averaged $117.92. Automotive Repair, Service & Parts averaged $27.94, and Restaurants & Food averaged $29.67. A restaurant inquiry, an automotive service request, and a software demo may all count as “leads,” but they don't carry the same qualification burden, sales process, or revenue potential.
A demand-generation manager who compares a SaaS campaign with a restaurant benchmark is not benchmarking. They're replacing commercial context with a number that happens to be easy to quote.
The contact is not the opportunity
Consider two hypothetical campaigns. Campaign A generates inexpensive form submissions from broad searches. Campaign B attracts fewer contacts through tightly matched searches for a specific business problem. The second campaign may show a worse raw CPL, yet sales may spend less time filtering it because the prospects match the ideal customer profile.
That difference is central to SaaS customer acquisition cost. Acquisition economics depend on what happens after capture, including qualification, sales acceptance, opportunity creation, and closed revenue. A raw lead metric hides every one of those transitions.
Commercial rule: Treat CPL as a diagnostic entry point, not as the final verdict on campaign efficiency.
B2B and SaaS companies often sell products that require discovery calls, technical validation, procurement, security reviews, or multiple stakeholder conversations. A contact that downloads a guide may be useful for nurturing, but it isn't equivalent to an account requesting a relevant demo. If both contacts enter the same CPL report, the report rewards volume while concealing sales effort.
The practical shift is simple. Keep raw CPL, but put it beside cost per MQL, cost per SQL, cost per opportunity, and cost per acquired customer. Once those measures sit in the same dashboard, the cheapest lead source may stop looking cheap.
How to Calculate Cost Per Lead Accurately
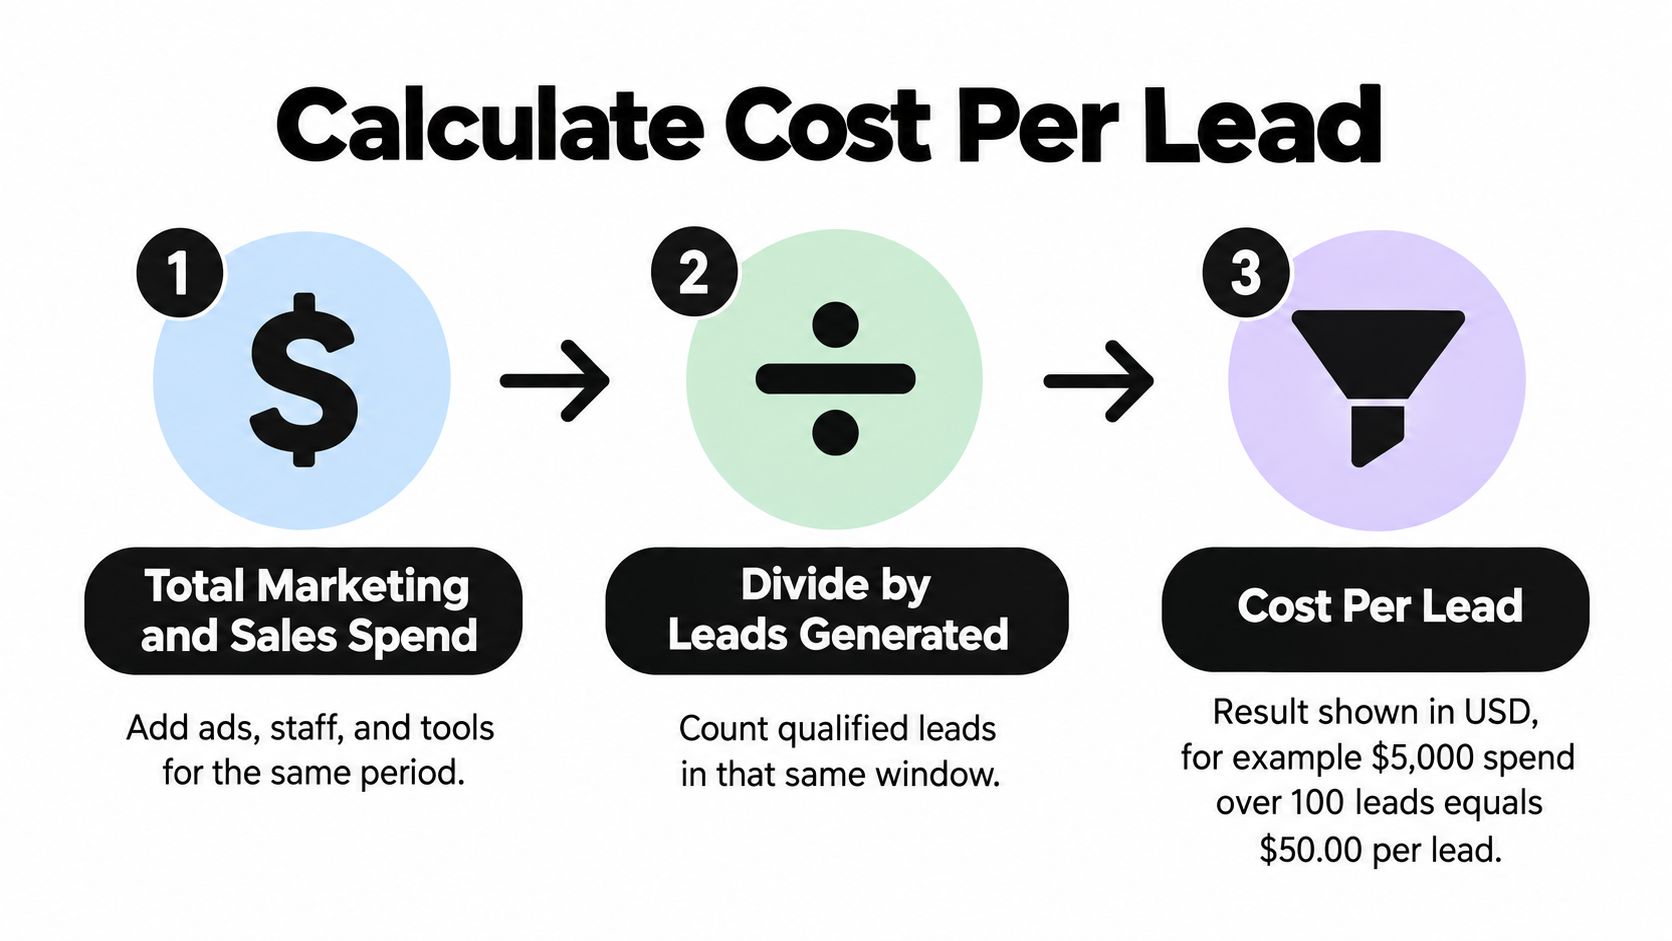
The basic formula is straightforward:
Cost per lead = total marketing and sales spend ÷ leads generated during the same period
The difficulty lies in defining both sides consistently. Spend may include advertising, content production, events, sales tools, agency fees, staff time, and automation. Leads must be counted within the same reporting window and according to a clearly documented definition.
For example, if a team spends $10,000 on Google Ads, content creation, events, and sales tools during a month and records 150 leads, the resulting CPL is $66.67. That calculation is mathematically correct, but it becomes misleading if some of those leads were captured earlier, duplicated in the CRM, or never met the company's qualification standard.
Build the calculation in layers
Start with a narrow paid-media view, then expand toward a blended acquisition view.
- Paid-channel CPL: Divide platform spend by captured leads attributed to that channel. This isolates media efficiency.
- Program CPL: Add creative, landing-page, content, and campaign costs. This reflects the cost of operating the program.
- Blended lead cost: Include relevant marketing, sales, data, CRM, and automation costs. This shows what the company spends to create demand across the system.
The right view depends on the decision. A media buyer may need paid-channel CPL to adjust targeting. A finance leader needs blended cost to understand whether the acquisition model produces acceptable margins. Mixing both views creates confusion, so label each calculation clearly.
Track every funnel stage
A useful measurement framework assigns a count and cost to each stage:
| Funnel stage | What to record |
|---|---|
| Raw lead | Every captured contact that meets the minimum data standard |
| MQL | A contact that matches the agreed marketing qualification criteria |
| SQL | A prospect accepted for sales follow-up |
| Opportunity | A qualified commercial conversation with a realistic buying path |
| Customer | A closed account linked to the acquisition source |
Cost at each stage rises when fewer contacts progress forward. That's not necessarily bad. Filtering can remove low-fit records and concentrate resources on accounts with stronger commercial potential.
Your CRM should preserve the original source, campaign, landing page, qualification result, owner, and stage history. A sales pipeline visibility framework helps connect marketing activity with sales outcomes instead of leaving each team to report a different version of performance.
Use one attribution rule for the reporting period, document exceptions, and reconcile the CRM with ad-platform data. The objective isn't perfect attribution. It's a consistent model that supports budget decisions.
The video below provides another visual explanation of the basic calculation:
B2B and SaaS Lead Generation Cost Benchmarks
Generic advertising averages are poor comparators for B2B and SaaS because they often count different types of contacts. A consumer campaign may optimize for a simple inquiry, while a SaaS campaign may need an account that fits a specific company profile, uses relevant technology, has a defined need, and can enter a sales process.
A 2024 B2B sales-and-marketing benchmark reported average cost per MQL of $240 for companies with annual contract value below $50,000, $269 for ACV from $50,000 to $100,000, and $186 for ACV above $100,000, as summarized by ADV's B2B lead-generation benchmarks. The pattern is counterintuitive. Higher-value businesses don't always pay more for each qualified lead.
Why deal size changes the benchmark
Enterprise-oriented programs can use narrower targeting and stronger qualification. They may reject more casual contacts before sales receives them, which can reduce the number of accepted MQLs while improving fit. A higher contract value also gives the company more economic room to invest in qualification, research, and sales development.
That doesn't mean enterprise acquisition is automatically efficient. It means the benchmark must reflect the relationship between lead quality, deal value, conversion, and margin. A lower ACV business may need a much tighter cost structure because each customer supports less revenue. A higher ACV business can tolerate a higher qualified-lead cost if opportunities progress reliably.
The same B2B benchmark source places average CPL across channels near $198, while quality-focused programs can range from approximately $40 to more than $650, depending on industry, channel, and the definition of a lead. That range isn't a contradiction. It demonstrates that “lead” is not a standardized commercial unit.
Compare like with like
Use the following filters before accepting an external benchmark:
- Qualification level: Is the figure based on a form submission, MQL, SQL, or opportunity?
- Contract economics: Does the benchmark reflect a comparable ACV and sales cycle?
- Channel mix: Are paid search, outbound, content, events, and referrals combined?
- Geography: Does the audience operate in the same market and buying environment?
- Attribution scope: Does the cost include only media or the full acquisition program?
A B2B team should compare a qualified SaaS lead with another qualified SaaS lead, not with an unqualified consumer inquiry. The lead-generation funnel should define those stages before the dashboard compares their costs.
The most useful benchmark may be internal. Once a company records stage definitions consistently, it can compare campaigns against its own cost per opportunity, opportunity-to-customer conversion, gross margin, and payback expectations. External figures then provide directional context rather than a target that distorts budget allocation.
The Hidden Cost of Cheap Leads
The 2025 Google Ads benchmark reported an average CPL of $70.11 across industries, but the category range was wide. Automotive repair averaged $28.50, Business Services $103.54, and legal services $131.63, according to Search Engine Land's analysis of Google Ads costs.
Those figures don't prove that automotive leads are better or worse than legal leads. They show why a single average cannot explain acquisition economics. Different categories attract different intent, purchase complexity, qualification requirements, and sales workflows.
Cheap at capture, expensive in operations
A low CPL can create hidden costs in at least four ways:
- Sales filtering: Reps spend time reviewing contacts that don't match the target account profile.
- Follow-up waste: Automated sequences and manual outreach continue after commercial fit has already failed.
- Reporting distortion: Marketing receives credit for volume while sales absorbs the qualification burden.
- Opportunity displacement: Teams may neglect stronger accounts while pursuing a large queue of weak contacts.
The correct comparison is not Campaign A at one CPL versus Campaign B at another. Compare the full path from spend to revenue. A campaign with a higher raw CPL can be economically superior when its contacts become MQLs, opportunities, and customers at stronger rates.
Replace the vanity metric
A useful dashboard should place CPL beside:
- Lead-to-MQL rate, which tests whether captured contacts meet the marketing definition.
- MQL-to-opportunity rate, which shows whether qualification identifies genuine commercial potential.
- Win rate, which connects opportunities with closed business.
- Gross margin, which prevents revenue from being treated as pure economic return.
- Payback period, which shows how long the business must recover acquisition investment.
These metrics answer a question that raw CPL cannot: how much investment is required to produce profitable growth? They also reveal where intervention belongs. Weak lead-to-MQL performance points toward targeting or offer problems. Weak MQL-to-opportunity performance may indicate poor qualification or sales handoff. Weak win rates can expose positioning, pricing, product, or sales-process issues.
A higher lead price is acceptable when it buys a materially better path to revenue. A low lead price is a liability when it fills the pipeline with accounts nobody can close.
Optimization Strategies That Reduce Cost Per Lead
Reducing CPL doesn't start with cutting bids. It starts with removing waste between audience selection, conversion, qualification, and follow-up. A campaign becomes more efficient when the company captures more of the right demand and stops paying operational costs for poor-fit contacts.
Tighten targeting before increasing volume
Start with the customer profile. Define the industries, company characteristics, roles, problems, buying triggers, and disqualifiers that matter. Then align search terms, audience filters, ad copy, and landing-page language with those criteria.
Negative keywords can prevent irrelevant paid-search traffic. LinkedIn and account-based campaigns can narrow exposure to roles and companies that sales can serve. The metric to watch isn't only click volume. Track qualified-lead rate, sales acceptance, opportunity creation, and cost per opportunity after each targeting change.
A narrower audience may reduce raw lead volume while improving commercial efficiency. That's a productive trade when sales capacity is limited.
Automate qualification and routing
Every inbound lead should receive the same initial treatment. Form validation can identify missing or implausible information. Enrichment can add company context. A scoring model can prioritize contacts based on fit and stated intent, while routing rules send each record to the correct owner.
Automation also prevents lead leakage. A prospect who submits a demo request shouldn't wait for a manual spreadsheet transfer before entering the CRM or receiving a relevant response. Measure routing accuracy, response completion, sales acceptance, and time from capture to first action.
MakeAutomation offers frameworks for lead generation, CRM automation, AI-enhanced operations, and voice AI agents for inbound and outbound calls. It can be considered alongside resources such as Stimulead on AI-powered leads when evaluating automated qualification and engagement approaches.
Improve the conversion path
A landing page should make the next action obvious and connect directly to the promise in the ad or content. Test one meaningful change at a time, such as audience-specific copy, a shorter form, stronger qualification questions, or a clearer meeting offer.
Don't judge a landing-page experiment by form completion alone. Compare qualified-lead rate and cost per qualified opportunity. A shorter form may increase submissions but weaken the information available for routing. A longer form may reduce volume while improving sales readiness.
Use conversational experiences carefully
An AI chatbot can answer common questions, identify buying intent, and collect context outside normal working hours. Its value depends on the handoff. If the bot creates records without clear qualification or sends prospects to an unprepared sales queue, it shifts work rather than reducing it.
Define escalation rules, approved answers, data fields, and human review points. Track qualified conversations, booked meetings, attendance, opportunity creation, and customer outcomes instead of counting chatbot interactions as success.
Review against customer cost
Review campaigns using the deepest reliable stage. If one channel produces cheap contacts but weak opportunities, reduce its budget even if the platform reports strong CPL. If another channel costs more per contact but produces better-fit accounts, protect it while improving its conversion path.
Measurement principle: Optimize the lowest stage your data can support, and keep improving the data until that stage is customer acquisition cost.
Building a Sustainable Lead Generation Cost Framework
A sustainable framework turns acquisition data into a recurring operating process. It doesn't require an elaborate analytics stack. It requires agreed definitions, reliable source data, and a dashboard that connects marketing spend with commercial outcomes.
The first decision is to define what each stage means. A raw lead might be a valid contact record. An MQL might need to match the target profile and express relevant interest. An SQL might require sales acceptance. An opportunity should represent a genuine buying path, not merely a completed call.
Measure the full funnel
Assign every lead a source and preserve that source as the record advances. Your monthly dashboard should show:
- Spend by channel: Advertising, content, events, tools, agencies, and relevant labor.
- Volume by stage: Leads, MQLs, SQLs, opportunities, and customers.
- Conversion between stages: The percentage of records that progress.
- Cost by stage: Spend divided by the number reaching each stage.
- Revenue contribution: Closed revenue and gross margin associated with each source.
- Payback view: The time required to recover acquisition investment.
Avoid changing definitions midway through a reporting period. If marketing changes the MQL standard, record the change because it affects comparisons with earlier data.
Optimize cost per customer
Cost per acquired customer is the metric that forces the organization to reconcile marketing and sales reality. It includes the cost of generating demand, qualifying accounts, running sales conversations, supporting the evaluation, and closing business.
The right target isn't the lowest possible customer cost in isolation. It is a customer cost that fits the economics of the offer, including gross margin, retention assumptions, and payback tolerance. A channel that looks expensive at the lead stage can be attractive if it creates accounts that close with healthy economics. A cheap channel can become destructive if it produces contacts that consume team capacity without creating pipeline.
Review, learn, and reinvest
Run a recurring review with marketing, sales, and operations. Ask three questions:
- Which sources created opportunities rather than contacts?
- Where did qualified records stop progressing?
- Which process change should receive the next test?
Use the answers to adjust targeting, qualification rules, landing pages, routing, nurture, and sales follow-up. Keep a record of each change and its effect on stage progression. That creates institutional knowledge instead of forcing every campaign manager to repeat the same experiments.
A strong system also exposes disagreement. If marketing reports an efficient CPL while sales reports poor lead quality, the dashboard should show where the divergence occurs. The solution may be a revised definition, better routing, a different offer, or a more specific audience.
The sustainable advantage comes from closing the feedback loop. Spend creates leads, lead handling creates qualification data, qualification creates pipeline insight, and pipeline outcomes guide the next budget decision. That is how lead generation cost per lead becomes a management system rather than a promotional headline.
MakeAutomation helps B2B and SaaS teams build automated lead-generation frameworks, CRM workflows, qualification processes, and AI-enhanced operations that connect acquisition activity with pipeline outcomes. If you want to replace raw CPL reporting with clearer cost-per-opportunity and cost-per-customer visibility, visit MakeAutomation to discuss the workflow and automation support your team needs.