
Automation Maturity Model: Levels and How to Assess Yours
The popular advice is to automate more work, add AI agents, and push toward unattended execution. That's the wrong sequence if your CRM contains conflicting records, nobody owns failed runs, or your team can't explain whether the automation saves time.
An automation maturity model should help you choose the next operational improvement, not the next software subscription. For a B2B or SaaS team, the practical test is whether integration, ownership, measurement, and human oversight can support the workflow. The weakest of those capabilities should decide what you build next.
Automation Maturity Levels at a Glance
Think of automation maturity as a staircase. You can only stand safely on a higher step when the step below holds your weight. Connecting applications won't fix an undocumented process, and autonomous decisions won't become dependable just because the software can execute them.
Five automation maturity levels
| Level | Stage | What the operation looks like | Signal you have reached it |
|---|---|---|---|
| 1 | Manual and ad hoc | Work runs through inboxes, spreadsheets and memory | Tasks finish late and depend on specific people |
| 2 | Documented | Processes are written down with named owners | Steps are repeatable but still performed by hand |
| 3 | Connected | Deterministic steps run automatically across tools | Data moves between systems without re-entry |
| 4 | Measured and optimized | Cycle time, error rate and exceptions are tracked | Workflow changes are driven by measured results |
| 5 | Governed and autonomous | Low-risk decisions run unattended under approval rules | Every automated action is logged, reviewable and reversible |
These stages are a practical framing, not a certified assessment scale. Use them as shared language for discussing observable behavior, rather than awarding the whole company a label because one department has an impressive workflow.
How this compares with a formal scale
ISO 22549-2:2020 uses six levels, from Level 0 Unidentified through Identified, Measured, Analysed, Optimized, and Level 5 Autonomous, and specifies indicators, descriptive characteristics, and questionnaires rather than a tool checklist. Its focus is industrial integration, so the comparison with business-process automation is approximate.
This article's manual stage roughly corresponds to ISO's unidentified and identified stages. Measured and optimized broadly aligns with Optimized, while governed autonomy corresponds conceptually to Autonomous. The intermediate steps don't map directly.
Starting point: Find the row that describes your most important workflow on an ordinary working day, including what happens when something fails.
For example, a form that creates a Salesforce record automatically may look connected. If an operations coordinator still exports that record to decide its owner, the complete routing workflow hasn't reached the same stage as the form integration.
Mark the row you can defend with evidence. That's your assessment starting point, not a judgment about your team's ambition.
What an Automation Maturity Model Actually Measures
An automation maturity model is an action-oriented set of discrete levels that rates how an operation runs work, not how many bots or agents it owns. Assessing it is a team exercise because the builder rarely sees every workaround.
Start with the process map and the people responsible for keeping it running.

The approach developed from the Capability Maturity Model tradition of the early 1990s, according to a 2021 systematic review of automation maturity models, which found that only 2 of 10 identified studies specifically evaluated intelligent-automation processes. Those covered a clinical-research model and a company- or function-level AI-tool model, illustrating why assessment still isn't one universally standardized discipline.
Assess capability, not inventory
Say a SaaS company has automations for enrichment, outreach, onboarding, and renewals. Yet its account-assignment spreadsheet belongs to someone who's on leave, and nobody else understands the formulas. The company has deployed software without establishing dependable ownership.
The Business Process Automation Maturity Model evaluates organizational automation capabilities in connection with an explicit vision and strategy. Translate that into an observable scorecard:
- Process and ownership: Written steps, a named accountable person, and a trained backup.
- Data and integration: Defined fields, validation rules, and reliable system handoffs.
- Skills and governance: People who can maintain the workflow, with approval and recovery procedures.
- Measurement and strategy: Operating metrics tied to a business outcome worth improving.
Ask a same-day question: If the builder left next week, would this workflow keep running with understandable logs and a second owner? Test the answer by having the backup investigate a failed run without coaching.
Use the process walkthrough below alongside that discussion.
Advancement should change cycle time, error rates, labor use, or revenue capacity. Otherwise, the assessment becomes a software trophy rather than an investment roadmap.
Finding the Dimension That Holds You Back
Four dimensions decide how far a workflow can climb: integration, ownership, measurement and human oversight. Whichever scores lowest decides the next build. A company can run a dozen automations and still stall at Level 2, because deployment counts hide the weak step on the staircase.
A BPM maturity assessment at a financial institution found exactly this pattern: strategic alignment, governance, and IT scored Level 3, while methods, people, and culture stayed at Level 2. The institution had funded the platform layer and left the operating layer behind. Infrastructure spending cannot make staff follow an unclear procedure or assign accountability for exceptions.
Integration creates the same trap behind an impressive deployment count. A tool that cannot read or write reliable data from the systems around it generates manual work no matter how capable it looks in a demo, and each workaround pulls the workflow's real maturity down.
Look for evidence in each dimension
Use these signals as diagnostic anchors. A workflow can match the documented stage overall while a single dimension lags, and that lag is where the next investment belongs.
Dimension signals at Level 2 and Level 4
| Dimension | Level 2 signal | Level 4 signal | Quick check |
|---|---|---|---|
| Process methods | Steps written, but performed differently by each person | One standard method under version control | Two people run the same task and get the same result |
| Data quality | Duplicate or missing CRM fields | Validation rules block bad records at entry | Share of records failing validation each week |
| Integration | Point-to-point connections and manual exports | Integrations monitored with alerts | Number of manual exports per week |
| Governance | No named owner for each automation | Owners, approval rules and audit logs in place | Can you name who approved the last change? |
| Skills and ownership | One builder who understands the logic | A second person can modify and document workflows | Count how many people can safely change the workflow |
| Change adoption | Staff bypass the automation | Staff use it and report exceptions | Human override frequency |
Say your sales team wants an AI lead-qualification agent, but territory fields contain inconsistent country names. The agent may qualify the lead correctly while routing it to the wrong salesperson. The plan reaches for Level 4 while data quality sits at Level 2, so the workflow inherits the lower score. Fixing schemas, field ownership, validation, and escalation is the more useful next build.
Treat a failing integration or data-quality check as a hard stop for expanding that workflow, and solve it before funding anything more ambitious.
Recheck operating performance
Score each dimension separately and prioritize the lowest one on the critical workflow path. Review these measures quarterly:
- Flow: Straight-through-processing rate, cycle time, and exception rate.
- Quality: Rework and data-error rate.
- Control: Uptime and human override frequency.
- Economics: Realized cost per transaction.
Investigate overrides rather than assuming they signal failure. A salesperson correcting a bad assignment points to weak territory data, while someone bypassing a sound process out of habit points to an adoption gap. The fix differs, so the diagnosis has to come first.
The lowest score sets the pace. When measurement is the weak dimension, buy reporting before autonomy. When oversight lags, add approval gates before adding agents.
How to Assess Your Current Automation Level
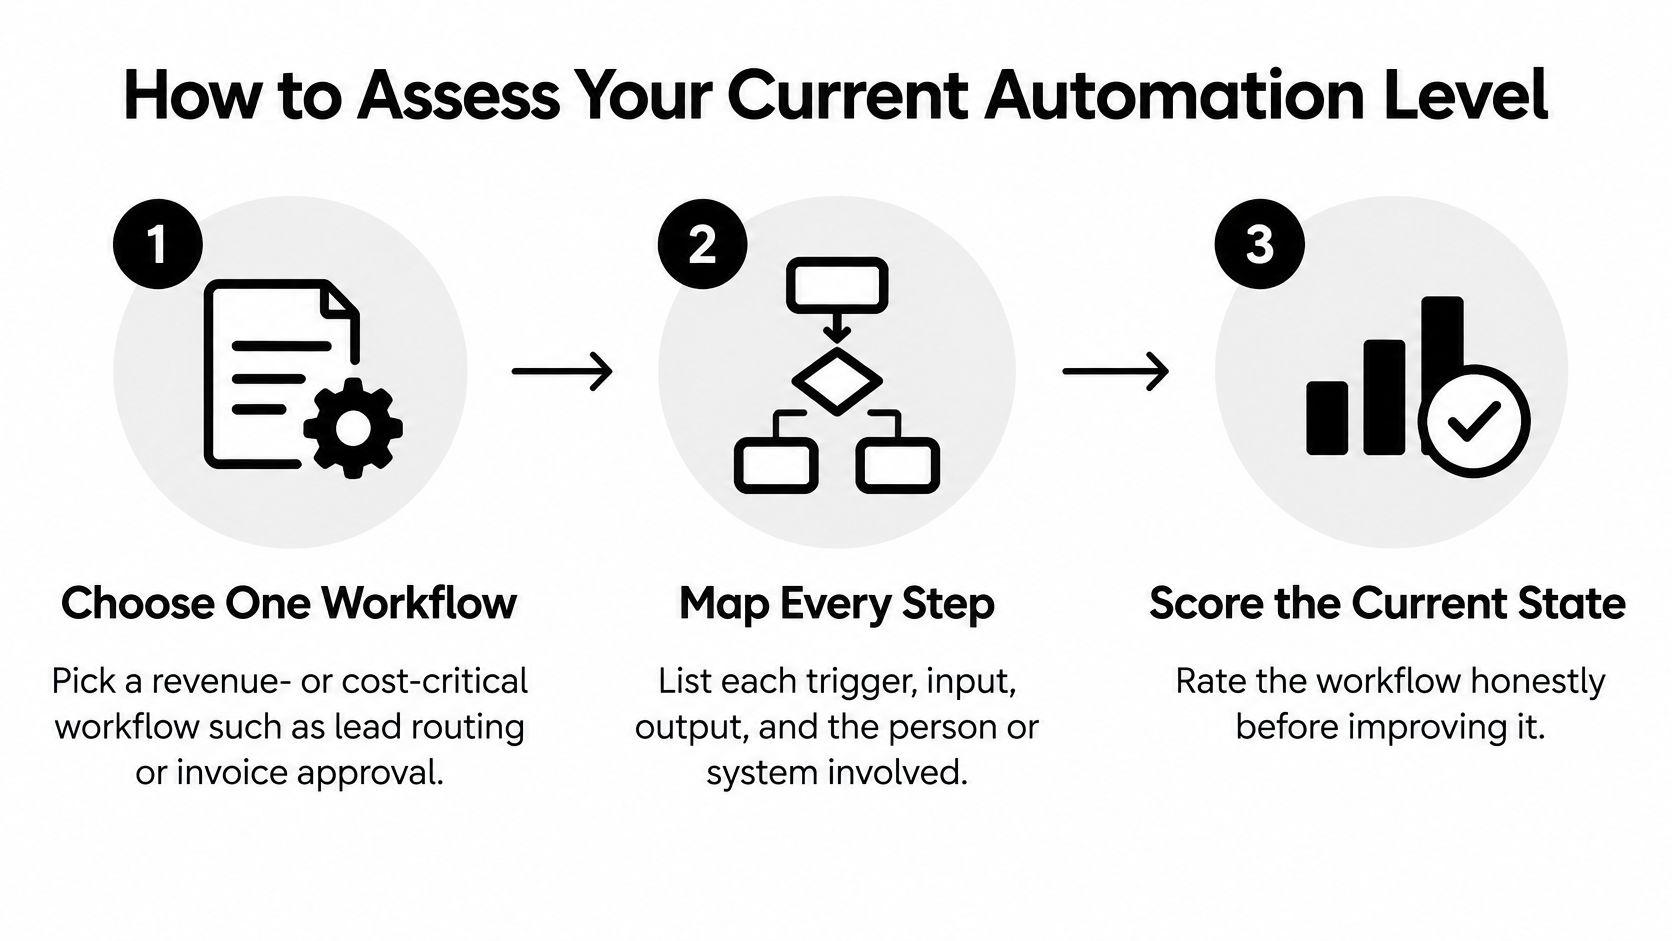
Begin with a workflow you can follow from trigger to outcome. Lead routing, invoice approval, and customer onboarding work well because their handoffs leave evidence in forms, CRM records, finance systems, and support queues.
Build an evidence-based baseline
Choose one revenue- or cost-critical workflow. Set a clear boundary, such as form submission through accepted sales assignment, so everyone scores the same work. Don't begin with a department-wide label like sales automation.
Map every step and handoff. Record the trigger, inputs, outputs, and responsible person or system, including what happens when required information is missing. The common mistake is mapping only the successful path and leaving exception handling out.
Score each step against the maturity staircase. Assign the level supported by current evidence: documentation, connected execution, measured improvement, or governed autonomy. Don't award points for features the platform offers but your team hasn't implemented.
Mark every human approval and correction. Separate intentional controls from hidden manual work, such as an employee repairing imported CRM records before assignment. A human checkpoint isn't automatically immature, but an undocumented dependency is a warning.
Record a transaction baseline. Count manual re-entries, exceptions, and rework against a consistent batch of completed transactions, retaining both the count and the denominator. Don't compare a quiet period with a busy campaign without accounting for volume and case complexity.
Score the dimensions as well as the steps. Rate each dimension from the diagnostic table using the same maturity scale, then write the lowest dimension score beside the lowest step score. For this conservative prioritization method, the workflow level is the lower of those results, not their average.
Repeat for other critical workflows and schedule reassessment. Give each result a named owner and a review quarter before comparing investment options. Don't let a strong onboarding workflow conceal weak invoice approval or unreliable lead routing.
For a broader organizational cross-check, Ekipa's six-dimension AI readiness scoring is a useful companion to workflow-level assessment. Keep that broader view separate from the evidence used to score a specific process.
What a usable assessment looks like
Your completed baseline should contain workflow names, scores, evidence, accountable owners, and the next constraint to fix. Someone outside the original workshop should be able to understand why you assigned each score.
Avoid score inflation: A sophisticated platform running undocumented work is still an undocumented operation.
For a first organizational view, our free Automation Readiness Assessment uses a business quiz. Use it to structure the conversation, then verify the result against actual runs, handoffs, and failure records.
How Human Oversight Changes as Autonomy Grows
According to McKinsey's State of AI 2025, 74% of surveyed companies planned to deploy agentic AI within two years, yet only 21% reported a mature governance model for autonomous agents. That gap makes oversight an operating requirement, not an administrative task to finish after launch.
The important question isn't whether software can act independently. It's when it may act, when it must ask, and when it must stop.
Define the decision boundary
Use a sales workflow to distinguish the oversight modes:
- Act: Route a standard inbound lead when its territory and account fields pass validation and the assignment follows a written rule. Log the action and retain a way to undo the assignment.
- Approve: Prepare a proposed discount or an exception for a high-value deal, but require the authorized person to confirm before committing it.
- Stop: Halt and escalate when required data fails validation, confidence falls below the team's accepted threshold, or the request falls outside policy.
These aren't permanent labels for entire applications. The same CRM workflow can execute routine assignments automatically while requiring approval for account conflicts.
A human-in-the-loop automation approach makes those checkpoints explicit instead of relying on someone to notice a mistake later.
Change oversight with evidence
At the connected stage, a person may still release consequential outputs even though the systems exchange data automatically. At the measured stage, exception rates and override patterns help determine which cases are suitable for unattended execution.
At governed autonomy, every unattended action needs an accountable owner, an approval rule, an audit log, and a reversal or recovery path. Where an action can't be reversed, require stronger approval before execution rather than pretending a log makes it safe.
Test adoption by naming the last automated rule change, who approved it, and which operating signal would return that action to human approval. If the team can't answer, it hasn't established a dependable control loop.
Selective non-autonomy can be the mature choice. Keeping judgment-sensitive decisions with people is better than raising the maturity label while weakening control.
What Automation Returns Look Like as Maturity Rises
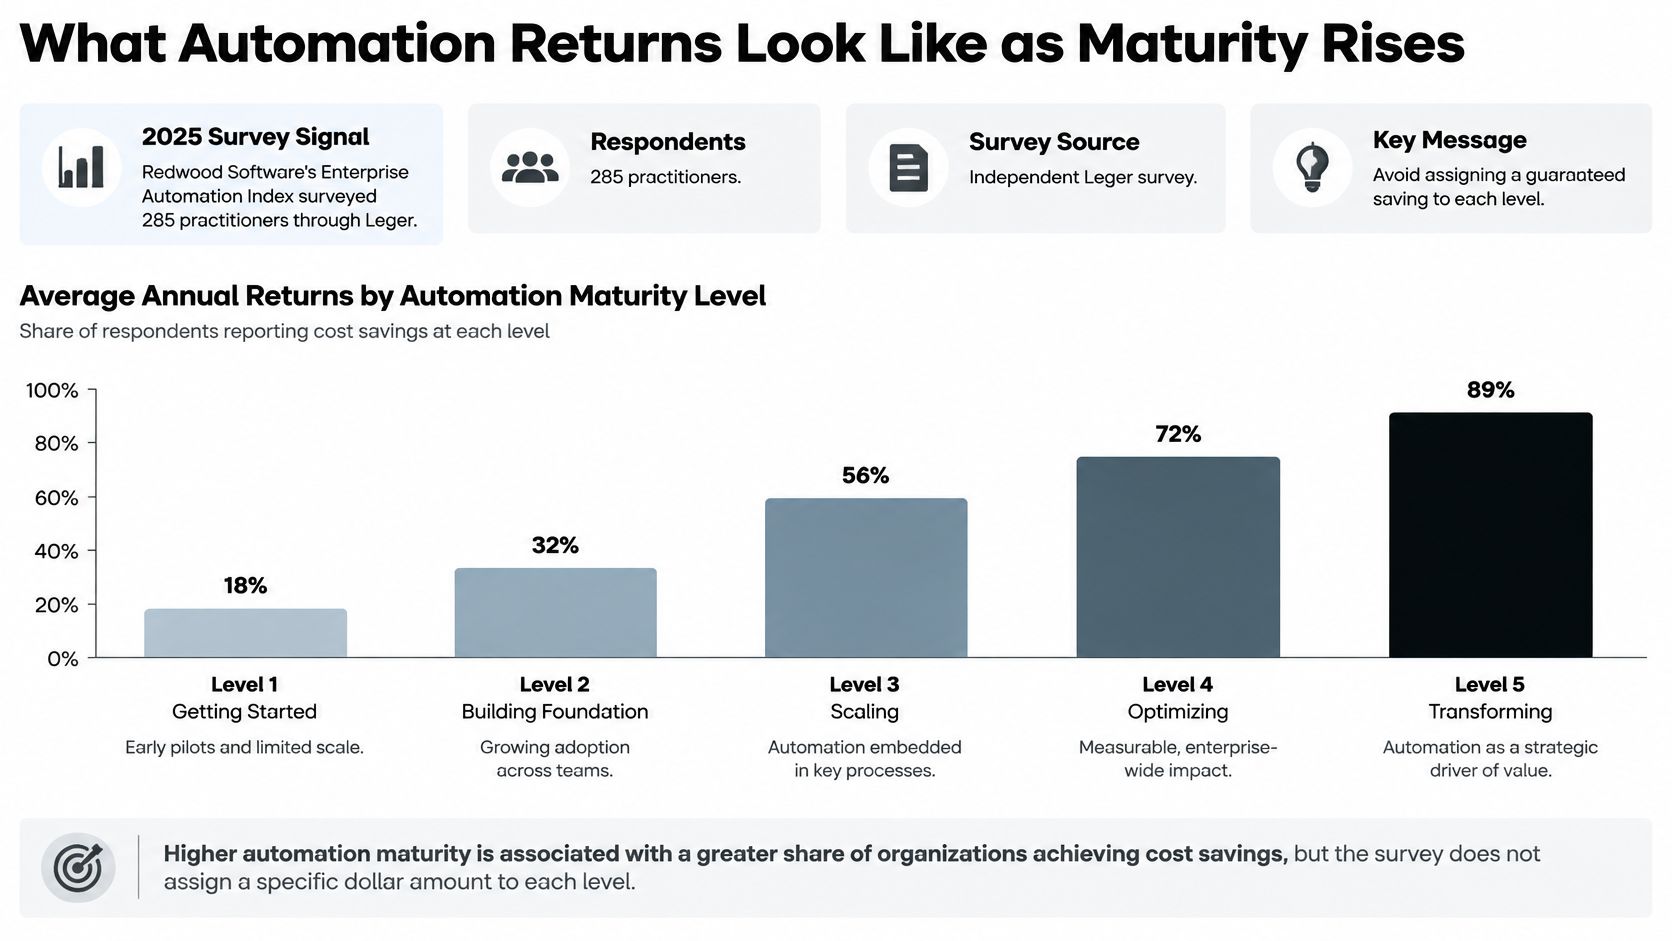
In 2025, 73.2% of businesses increased automation investment during the previous year, according to Redwood Software's Enterprise Automation Index, based on an independent Leger survey of 285 automation practitioners. Separately, 36.6% of organizations reported that automation reduced costs by at least 25%, according to the Index's published findings.
These are self-reported survey signals, not proof that buying a platform causes a particular saving. They also don't establish a guaranteed return for each maturity level.
Match the evidence to the operating stage
The appropriate proof changes as the workflow develops:
| Stage | Credible evidence of improvement |
|---|---|
| Documented | Fewer missed handoffs and less dependence on individual memory |
| Connected | Removed re-entry and reduced handling time |
| Measured and optimized | Before-and-after cost per transaction, with comparable workloads |
| Governed and autonomous | Reliable unattended execution without excessive recovery work |
For a hypothetical routing calculation, multiply your inbound lead volume by the manual handling time per lead, then convert the result into labor hours. Subtract the time staff still spend reviewing exceptions and maintaining the workflow.
That produces potential released capacity, not automatic cash savings. Finance should only count payroll savings when expenditure changes; sales leadership may instead use the capacity for faster follow-up or more account coverage.
Include the cost of keeping it running
A credible automation business case includes integration maintenance, failed-run investigation, human review, training, and software costs. Otherwise, the calculation counts time removed from one employee's queue while ignoring time added to another's.
Keep the comparison honest by recording workload, case mix, and quality alongside cost. Faster processing isn't a gain if employees must repair the output afterward.
Rising investment makes a before-and-after baseline more important, not less. Establish it before the next purchase so you can distinguish useful capacity from a busier technology stack.
A Sales Team Moving from Level 2 to Level 4
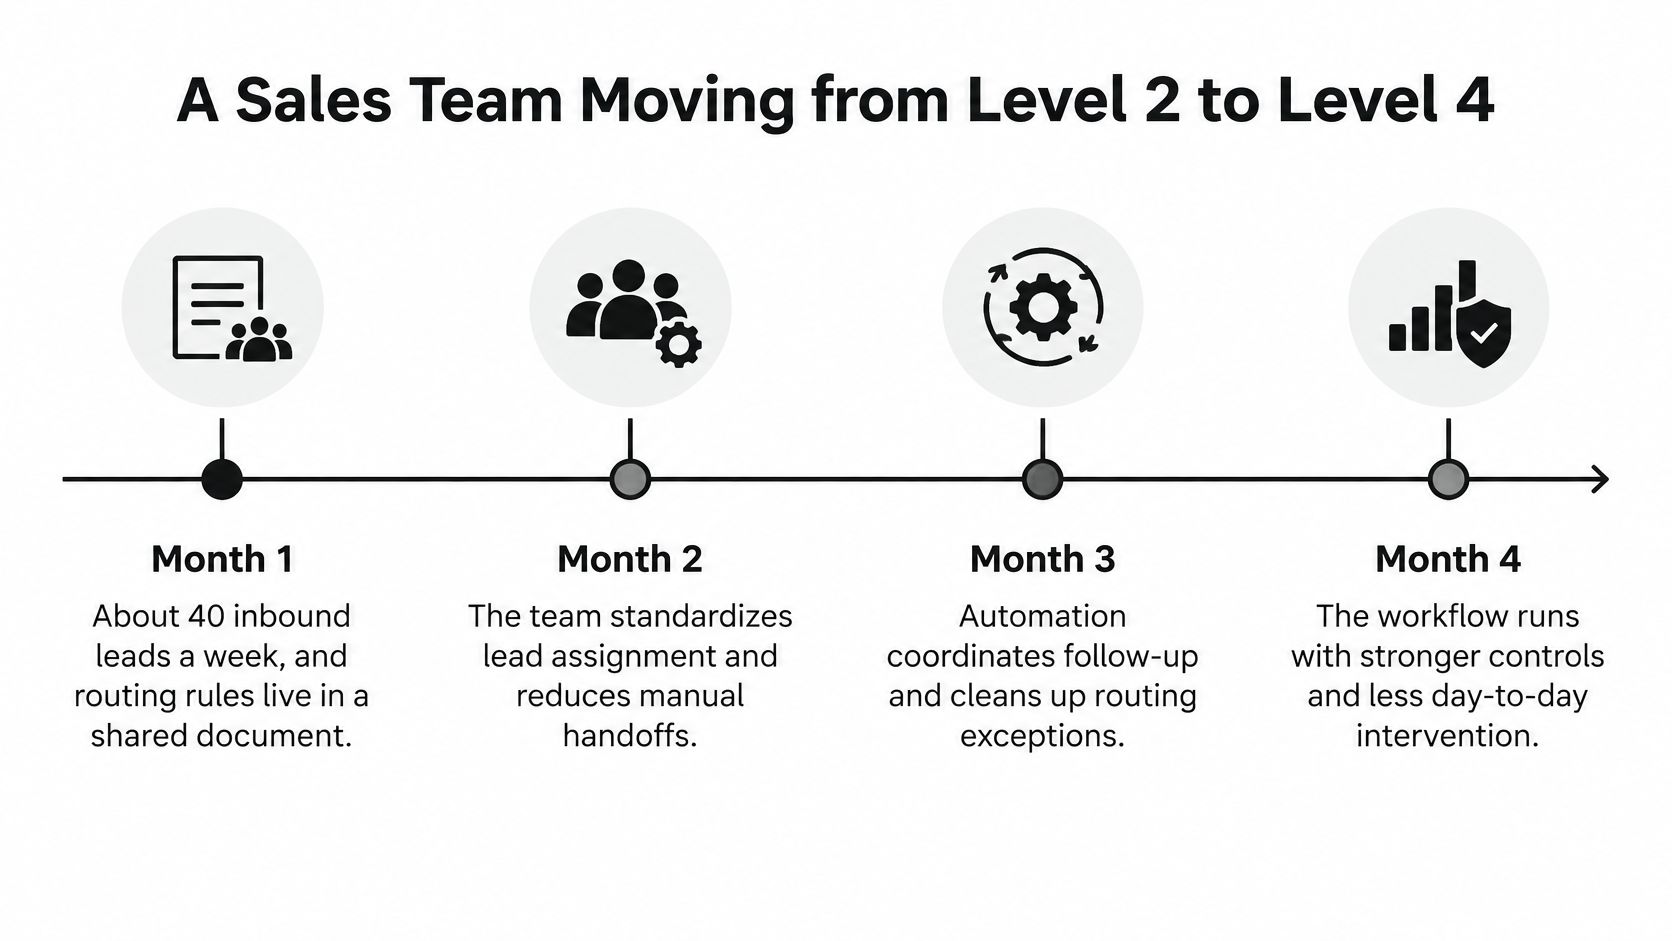
Consider an illustrative B2B SaaS team receiving a steady flow of inbound leads. Its routing rules live in a shared document, but sales representatives interpret account conflicts differently. The lowest row in its assessment is data quality, so the team starts there rather than adding qualification intelligence.
The monthly checkpoints below are a hypothetical planning sequence, not a vendor delivery schedule. Progress depends on meeting the operating conditions, not reaching a date.
Early checkpoints establish dependable routing
During the opening month, the sales operations manager assigns an owner to each routing rule and resolves conflicting territory definitions. The documented-stage checkpoint is a repeatability test: different team members must apply the rule to the same sample lead and reach the same assignment.
During the next month, the team moves routing into the CRM and connects the submission form. It validates territory and company size at entry, and sends incomplete records to an exception queue rather than guessing an owner.
The connected-stage checkpoint is concrete: the normal path no longer requires a manual export or retyping. Staff still handle ambiguous accounts, but those cases are visible and assigned.
The team wanted an AI qualification agent at the outset, but waited until validation met its agreed threshold and retained human approval for high-value deals.
Later checkpoints establish measured improvement
In the later months, the operations manager reviews speed-to-lead and misroute rate with sales leadership. Each proposed change records the observed problem, the rule being changed, and the expected operational effect.
For example, repeated account conflicts may justify checking existing account ownership before applying territory rules. The team compares results after that change rather than treating successful deployment as proof of improvement.
The measured-stage checkpoint is regular, evidence-led adjustment. The progress signals are fewer misroutes and a shorter gap between lead arrival and first contact, without moving hidden cleanup work onto representatives.
Confirm Your Level Before Your Next Automation Purchase
Make the purchase decision against the constraint, not the demo. Use the lowest step score and lowest dimension score as spending gates:
- Scores of 1 or 2: Don't buy a higher-tier tool for that workflow. Repair documentation, validation, ownership, or the failing integration first.
- A score of 3: Fund a specific missing connection or monitoring improvement, then compare handling effort and cost per transaction with the baseline.
- A score of 4: Consider unattended execution only for low-risk cases with established accountability and recovery controls.
In 2025, 67% of the most mature AI adopters reported large or very large returns across all 46 digital-transformation key performance indicators, compared with 61% of less mature adopters classified as Automators, according to Deloitte's Tech Value Survey. That's an association worth considering when sequencing investment, not a promise that advancing a score causes the same return.
Compare tools after defining the gap
Write the missing capability into a requirement before opening comparison pages. A recruitment team that needs reliable candidate ownership should evaluate assignment rules, integrations, and auditability rather than starting with an AI feature list.
For staffing-specific selection, the dreach guide to agency tools can help frame a shortlist once those requirements are clear. A comparison guide supports selection; it doesn't replace assessing the workflow.
Leave the decision meeting with one dimension to fix, one accountable owner, and one outcome to measure. That's a more useful commitment than adding another product to the stack.
MakeAutomation offers a free Automation Readiness Assessment business quiz to help you establish a starting view of your automation maturity. Our automation consulting maps your current process, identifies the highest-value opportunities, and gives you a practical sequence for what to build first. Visit MakeAutomation to assess your readiness or discuss the single workflow constraint you want to resolve next.