
Team Capacity Planning: The B2B & SaaS Operating Framework
86% of organizations forecast capacity regularly or occasionally, yet only 6% consider their forecasting capabilities extremely effective. Team capacity planning works when it turns available skills and hours into decisions about what to accept, delay, reassign, subcontract, train for, or automate.
That gap between routine forecasting and reliable forecasting is where most operating problems begin. Leaders may hold planning meetings, update spreadsheets, and review project pipelines, but still discover overload only after deadlines slip. In volatile B2B and SaaS environments, capacity isn't a fixed headcount number. It's a moving balance between delivery demand, skill availability, internal work, uncertainty, and the resilience required to absorb surprises.
The practical model is simple: calculate real available capacity, translate demand into hours by role and week, compare the two across multiple horizons, and act before the gap becomes a delivery failure. The difficult part is resisting attractive but damaging shortcuts, especially the assumption that higher utilization always means better operations.
Why Capacity Planning Fails: Headcount Math Instead of Live Operations
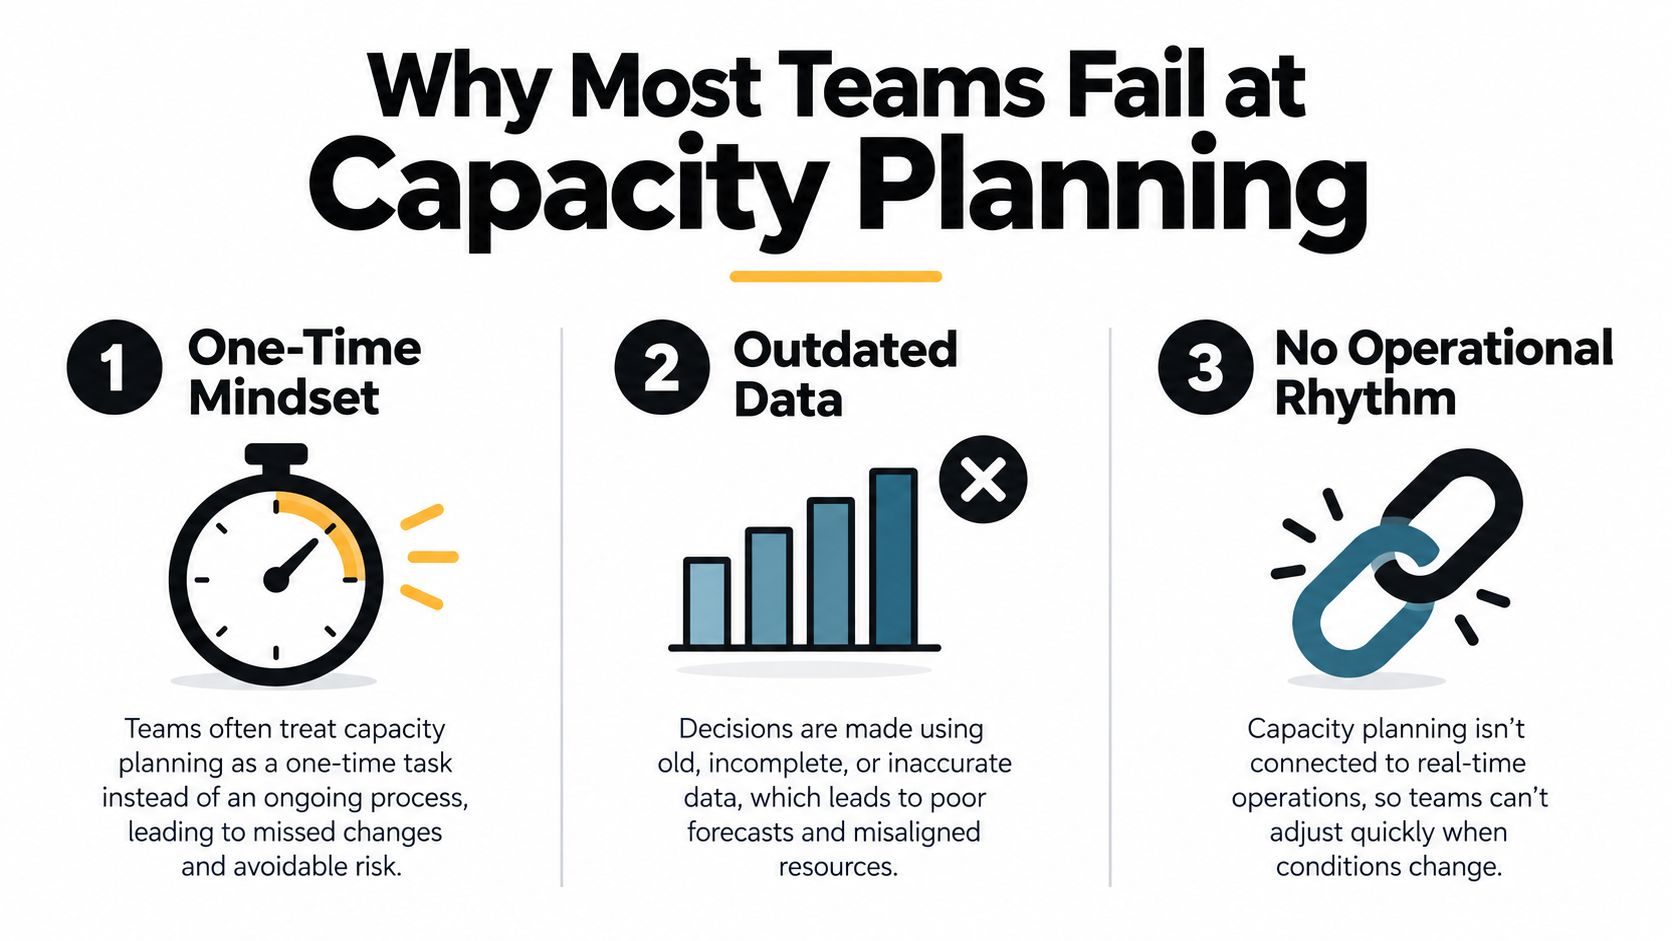
A six-person SaaS delivery team holds a monthly planning meeting, updates its headcount sheet, and still discovers in week three that the only implementation specialist is booked on escalations. The meeting existed, but the operating signal did not. Effective capacity planning must show deployable skills, current commitments, interruptions, and the buffer needed to absorb volatility.
The latest historical signal is revealing. In 2026, 86% of organizations said they forecast capacity regularly or occasionally, up from 81% in 2025, while only 6% said their forecasting capabilities were extremely effective (Runn's capacity planning statistics). Regular forecasting has become common, yet the process still fails when teams record headcount without tracking whether people can perform the work required this week.
The baseline is smaller than headcount suggests
Start with the hours a team can deploy:
Available capacity = total work hours minus PTO, administration, meetings, and non-billable work.
Then test that number against committed demand and required skills. A six-person team may appear adequately staffed while one person is away, another handles customer support, and a third holds the only technical capability needed for a launch. The project's usable capacity is therefore much lower than the team total.
Model capacity by person, skill, and time period. Department-level availability hides bottlenecks, and spare hours in one role cannot replace missing expertise in another. This view also exposes resilience risk: allocating every available hour leaves no room for escalations, defects, or urgent customer work.
Practical rule: If your plan cannot show who is available, which skills they bring, and when those hours can be used, it is not a capacity plan yet.
Forecasting must become an operating rhythm
Strategic workforce planning often runs on a slower cycle. In the 2026 survey, 39% of organizations reported doing it every two to three years, and another 39% did it yearly. The same Runn survey found that this cadence may suit broad workforce direction, but it cannot guide project allocation when pipeline demand, absences, and customer commitments change faster.
Use a rolling review to compare planned work with actual delivery, refresh leave and availability data, and flag specialist constraints before they affect dates. Teams can also use guidance to forecast staffing needs accurately when workforce information is split across systems.
Automation strengthens this rhythm by combining project demand, leave, support load, and skill data into a current view. It does not remove managerial judgment. It gives managers earlier evidence for deciding what to accept, delay, reassign, subcontract, train for, or automate, while protecting throughput and resilience.
Calculating Your True Available Capacity
Start with supply before you look at demand. If the supply number is inflated, every later decision becomes optimistic, including project dates, hiring requests, and sales commitments.
For a six-person SaaS account management team, begin by mapping each role rather than multiplying headcount by an ideal workweek. Separate account managers, implementation specialists, customer support coverage, and team leadership time. Their contracted hours may look similar, but their usable delivery hours won't be identical because meetings, escalations, administration, and customer communication affect each role differently.

Build the number from reality
Use a weekly capacity sheet with one row per person and separate fields for:
- Contracted time: The person's nominal working availability.
- Planned absence: PTO, public holidays, training leave, and known appointments.
- Operating overhead: Internal meetings, administration, email, reporting, and coordination.
- Standing service work: Support coverage, renewals, incident response, and customer escalations.
- Deployable project time: The remaining hours that can be assigned without creating hidden overtime.
For example, the account management lead may have significant coordination duties, while an implementation specialist may have more project-facing availability but still need protected time for technical preparation. Don't force both roles into one universal productivity assumption. The purpose of the model is to expose those differences.
The sourced capacity-planning guidance defines the calculation as available hours after accounting for PTO, meetings, non-billable work, and other obligations (Teamwork's workforce capacity planning framework). Track the deductions as actual categories instead of burying them inside an unexplained utilization percentage.
Turn availability into assignable slots
Once each person's weekly availability is visible, group the hours by skill and project. A customer onboarding request might require implementation expertise, account ownership, and support coordination. Those hours aren't interchangeable, even if the total team has unused time.
A defensible capacity view should answer four questions:
- Which people can take work?
- How many hours can they safely contribute?
- Which skills are constrained?
- Which existing commitments can move without damaging delivery?
Keep the source data current. Calendar changes should update availability, project changes should update demand, and time tracking should reveal whether the original assumptions were credible. Teams looking to formalize that process can use resource allocation optimization to connect workload visibility with allocation decisions.
Use the following video as an additional visual reference for structuring a capacity view:
A useful rule is to preserve a clear distinction between available hours and committed hours. The first describes supply. The second describes demand already promised. The gap between them tells you whether the team can absorb more work, needs intervention, or has room for planned development.
Forecasting Demand Across Multiple Horizons
A forecast becomes operationally useful when it separates certainty from possibility. Signed work, a late-stage opportunity, and an early strategic idea require different staffing decisions, so they should not share one undifferentiated demand column.
For a B2B SaaS implementation team, convert each opportunity into expected hours by role and week. A project may need solution design before kickoff, configuration during delivery, customer training near launch, and support afterward. Assign those hours to the required skills, then record how confident you are that the work will start.
Separate the three planning horizons
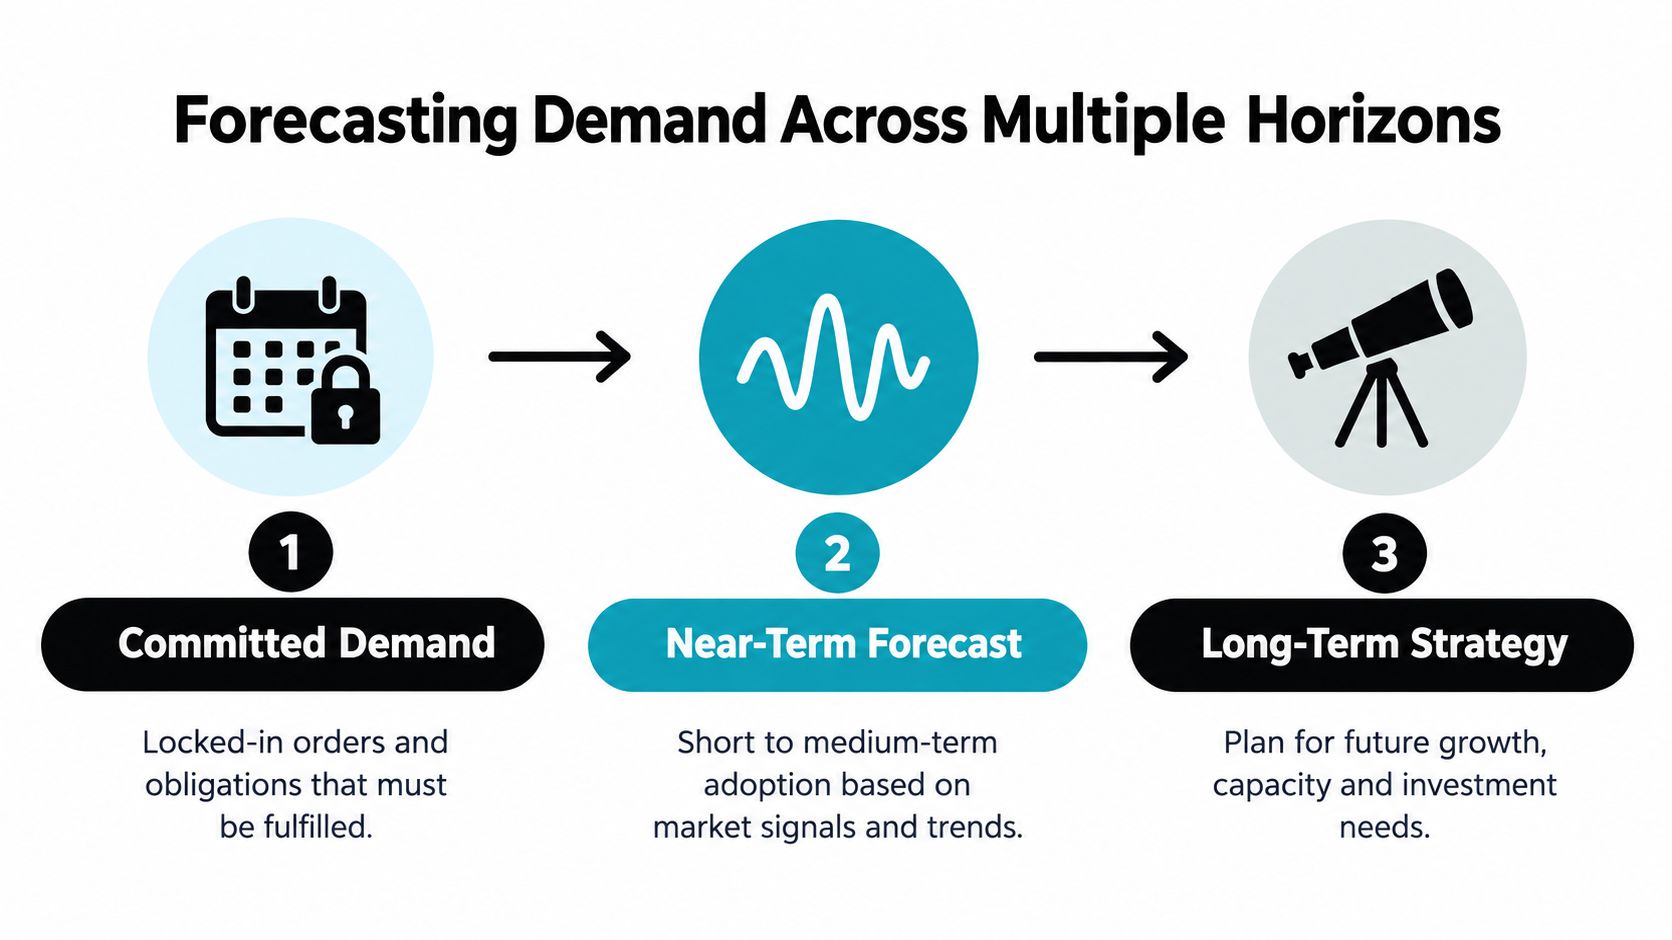
Committed demand covers signed work, active projects, confirmed renewals, and contractual obligations. Place it directly in the forward schedule. If it exceeds the available capacity for a required skill, change the scope, timing, staffing, or ownership. Hoping the team absorbs the gap only hides the decision.
Near-term forecast covers qualified pipeline, likely expansions, and opportunities with a credible start window. Convert expected work into hours, while keeping it visibly separate from committed delivery. That distinction prevents a pipeline opportunity from consuming staffing capacity before it closes.
Long-term strategy covers market assumptions, product direction, seasonal patterns, and possible hiring needs. Use these inputs to test scenarios rather than make firm promises. Strategic planning helps leaders compare options, but it becomes misleading when assumptions appear as scheduled work.
Model scenarios instead of one optimistic plan
If sales expects a strong quarter of implementation intake, do not convert the full target into immediate staffing demand. Break it into likely project types, role requirements, start windows, and confidence levels. Then create conservative, expected, and upside views.
The conservative view may retain the current team and delay discretionary contractor commitments. The expected view may activate a vetted external bench for a defined skill. The upside view may trigger hiring or cross-training if the pipeline converts and demand remains durable. This approach balances throughput with resilience instead of treating billable hours as the only measure of capacity.
A forecast isn't a promise. It's a decision tool that shows what you'll do under different conditions.
The Scrum Institute's capacity planning framework recommends reviewing work across 30-, 60-, and 90-day horizons, with the greatest detail in the nearest window (Scrum Institute's capacity planning framework). Keep farther-out estimates as ranges supported by explicit assumptions. Automation can refresh these views as pipeline stages, project dates, and staffing inputs change, improving forecast accuracy without turning uncertain demand into false precision.
Record why demand changed. A missed start date, expanded scope, or delayed renewal reveals where the forecast was weak. Over time, those reasons improve the assumptions used by sales, delivery, and staffing leaders.
The Hidden Danger of High Utilization
A team running at full allocation can look efficient in a dashboard while becoming less reliable in practice. Every person needs some operating space for customer escalations, quality checks, planning, mentoring, sales support, and estimates that miss. Remove that space, and routine variation turns into disruption.
Capacity planning guidance for Scrum teams suggests holding utilization near 70–80%, leaving a 10–20% capacity cushion for unplanned work (Scrum Institute's capacity planning guidance). That cushion is not idle waste. It protects delivery when priorities change, incidents appear, or work takes longer than expected.
Utilization is a constraint, not a trophy
An 80% allocation does not mean 20% of a consultant's time is freely available. Account development and proposal support still need attention. A support engineer may need that space for incidents that cannot be scheduled. A senior architect with every hour assigned can become a single point of failure when multiple projects depend on the same person.
Ask which utilization level lets each role deliver quality work while absorbing normal variation. The answer depends on role, skill scarcity, project phase, and margin profile. A single target across the organization hides those differences.
| Planning choice | Short-term appearance | Operational consequence |
|---|---|---|
| Fill nearly every available slot | Strong activity and little bench time | Urgent work displaces planned work |
| Protect a capacity cushion | Some hours remain unassigned | The team can absorb volatility |
| Hire for every peak | More apparent coverage | Fixed staffing may become wasteful when demand falls |
| Use a blended response | Capacity matches the shape of demand | Leaders balance reassignment, delay, subcontracting, training, and automation |
Decide what kind of gap you have
A temporary shortage does not automatically justify a permanent hire. Reassign work when demand is unevenly distributed. Delay or reduce scope when the request is not time-critical. Subcontract when specialized demand is sharp and temporary. Train when the skill will recur. Automate repetitive coordination or reporting when it consumes scarce human time.
Review the gap by duration, skill, and consequence. A short spike calls for a different response than a recurring shortage, and a scarce specialist creates more risk than an interchangeable task.
High utilization can increase scheduled output for a period, but it reduces the team's ability to respond when assumptions fail. Sustainable planning protects throughput and resilience together, using automation where it improves forecast accuracy rather than treating every available hour as billable capacity.
Moving Beyond Spreadsheets with Automation
Spreadsheets are useful for designing the first model. They become unreliable when project managers, sales leaders, finance teams, and employees update different versions at different times. The file may contain precise formulas, yet the underlying availability and demand can already be obsolete.
Manual tracking also creates a behavioral problem. People spend time preparing reports instead of improving allocations, and leaders review snapshots that hide changes between reporting cycles. A tool is only helpful if it reflects current commitments, availability, actual time, and pipeline assumptions in one operational view.
Compare the workflows
| Manual spreadsheet process | Automated operating process |
|---|---|
| Managers request updates by email | Systems sync approved records on a schedule |
| Project changes wait for the next edit | Changes flow into the planning view |
| PTO and availability are copied manually | Calendar and leave data can feed availability |
| Pipeline is discussed separately from staffing | CRM stages can inform scenario demand |
| Actual hours require reconciliation | Time records can be compared with planned hours |
The right architecture depends on team size and complexity, but the principle is consistent. Connect the project management system, CRM, calendar or leave system, and time-tracking platform. Establish one owner for definitions, such as what counts as committed work, available time, and a capacity gap.
Create a weekly automation SOP
A practical workflow can run as follows:
- Collect: Pull approved project assignments, CRM opportunities, leave records, and actual time data.
- Normalize: Convert role names, project phases, and time periods into consistent fields.
- Compare: Calculate available capacity against committed and forecast demand by skill.
- Flag: Identify overloads, unallocated time, stale assignments, and forecast changes.
- Route: Send exceptions to the operations lead, delivery owner, or sales leader for a decision.
- Archive: Preserve the weekly snapshot so planned versus actual results can improve later forecasts.
MakeAutomation works in this category by helping B2B and SaaS teams connect operational systems and automate reporting workflows. Its project management workflow automation is relevant when teams need project updates and allocation signals to move through a repeatable process instead of relying on manual reminders.
Automation doesn't remove judgment. It removes avoidable data movement, so leaders can spend their time deciding whether to reassign, delay, subcontract, train, or hire.
Monitoring KPIs That Actually Matter
A capacity plan needs control metrics, not a dashboard full of attractive but disconnected figures. Track the indicators that show whether supply is realistic, demand is visible, and decisions are correcting problems early.
The practical benchmark set includes utilization rate, capacity gap ratio, bench time percentage, and forecast accuracy, with the sourced guidance recommending role-dependent utilization of 70–85%, bench time of 10–20%, forecast accuracy of 85–95%, and a capacity gap ratio within plus or minus 10% (Teamwork's workforce capacity planning framework).
Read the signals together
- Utilization rate: Compare productive or billable hours with available hours. A high result alongside overtime, missed milestones, or quality problems signals overload rather than efficiency.
- Capacity gap ratio: Compare demand with available capacity. A result outside the recommended band indicates that leaders should adjust staffing, timing, scope, or commitments.
- Bench time percentage: Treat unallocated capacity as a controlled buffer, then investigate persistent excess. Too little buffer creates fragility, while too much may indicate weak demand visibility or a skill mismatch.
- Forecast accuracy: Compare actual demand with the prior forecast. Repeated misses usually point to incomplete pipeline data, weak estimates, or unrecorded work.
Use role-level views instead of relying only on a team average. A blended average can conceal a scarce specialist at overload while a generalist has unused time. That is why the metric review should include skill and margin context, not only volume.
For teams that need cleaner evidence of actual work, tracking billable hours can connect time records with the assumptions used in the capacity model. Review operational signals frequently enough to act, and review forecast quality less often but thoroughly enough to improve the model.
Building a Sustainable Planning Routine
Team capacity planning becomes dependable when it follows a small, repeatable cadence. The weekly meeting shouldn't rebuild the model from scratch. It should review exceptions, confirm changes, and assign decisions to named owners.
A practical weekly review can follow this sequence:
- Update availability. Confirm leave, role changes, new constraints, and ongoing internal responsibilities.
- Review committed work. Check whether project estimates, start dates, and assignments still reflect reality.
- Scan the next horizons. Separate confirmed demand from probable pipeline and longer-term assumptions.
- Inspect skill bottlenecks. Look for shortages by specialist role, not just total team hours.
- Choose interventions. Reassign, delay, reduce scope, subcontract, train, hire, or automate.
- Record the decision. Capture the assumption and owner so the next review can test whether it worked.
The monthly portfolio review should examine forecast accuracy, recurring demand shifts, margin implications, and whether a temporary gap is becoming structural. Strategic workforce planning can remain broader, but it should still receive current operational evidence rather than relying on an old headcount plan.
Protect the buffer, document the trade-off, and make every capacity gap someone's decision to resolve.
Economic uncertainty makes this discipline more important. In 2026, organizations reported that economic uncertainty was a larger planning challenge than AI uncertainty, while the gap between regular forecasting and effective forecasting remained substantial (Productive's capacity planning guide). Resilient operators don't staff only for the best case. They build scenarios, preserve optionality, and automate the data collection needed to act before constraints reach customers.
Start with one team, one capacity formula, and one weekly review. Once the data is trustworthy, connect it to sales commitments, delivery dates, and financial decisions. The objective isn't a perfect forecast. It's a faster, calmer operating cycle that makes the next decision better than the last.
MakeAutomation helps B2B and SaaS teams automate project updates, CRM signals, time tracking, reporting, and repeatable operating procedures that support accurate capacity planning. Visit MakeAutomation to discuss a workflow that gives your team clearer availability data and faster allocation decisions.