

Churn Prediction for SaaS: Build Models That Drive Retention
Better churn prediction won't automatically reduce churn. A model can rank accounts with impressive accuracy, yet produce no retention lift if the customer success team doesn't know what to do, the CRM doesn't trigger the right workflow, or the intervention arrives after the renewal decision is effectively made.
The practical standard is different. A useful churn prediction system connects behavioral signals, risk scores, intervention playbooks, CRM automation, and measured outcomes. Model performance matters, but only after the business can turn a score into a timely decision that a real person or workflow can execute.
Why Most Churn Prediction Projects Fail to Reduce Churn
The most popular advice says to improve the model. In production, that's often the wrong first move.
A telecom study using several terabytes of mobile network data reported a best-model accuracy of 89.4%, with natural churn during the evaluation period at roughly 24%. Accuracy across the tested algorithms remained in a narrow band of about 88.5% to 89.5%, showing that churn prediction had already become a credible early-warning capability rather than a basic classification exercise by the mid-2010s. You can review the study in this peer-reviewed Scientific Reports paper.
More recent benchmark research has reported higher results. A 2024 comparison of machine-learning algorithms recorded 95.32% accuracy for gradient boosting, 94.29% for random forest, and 95.35% for an ensemble-fusion model, with an F1-score reaching 96.96%, as documented in the research record on churn prediction algorithms. Those results are useful evidence that modeling techniques have improved. They aren't proof that a SaaS company will save more accounts.
The score is not the intervention
A risk score sitting in a warehouse is only a data artifact. It doesn't contact a customer, diagnose an onboarding failure, repair a billing issue, or give a CSM enough context to have a productive conversation.
The failure usually begins with the objective. Data teams optimize AUC, accuracy, or feature importance because those metrics are easy to calculate and present. Retention teams need different answers:
- Who needs attention now?
- What changed in the account?
- Which intervention matches the likely cause?
- Who owns the next action?
- How will we know the action worked?
A model built around available data often produces a list of likely churners. A model designed backward from retention actions produces a prioritized queue with a reason, an owner, a deadline, and a playbook.
Practical rule: Don't approve a churn model until every risk segment has a defined action, owner, and outcome field in the CRM.
False positives create their own damage. If a CSM repeatedly receives alerts for healthy accounts, the team learns to ignore the system. If the model identifies genuine risk but the account has no available intervention, the score becomes a report about a problem nobody can solve.
Prediction and prevention therefore require separate design work. The model estimates risk. The business decides how much outreach it can fund, which customers justify human attention, and whether the appropriate response is education, product support, billing recovery, executive engagement, or no intervention at all.
Data Foundations and Feature Engineering for SaaS Churn
A production churn model needs more than login counts and plan type. Those fields may provide a baseline, but they rarely explain whether a customer is achieving the outcome that justified the purchase.
The strongest feature sets combine four data layers. Product telemetry captures feature adoption, workflow completion, API activity, session frequency, and the depth of usage. Engagement data adds communication response, support ticket movement, training attendance, meeting participation, and changes in stakeholder activity. Commercial signals include contract terms, payment events, expansion or contraction behavior, renewal timing, and invoice history. Organizational context covers company maturity, industry, team changes, champion movement, and the scope of the original business case.
| Data Category | Example Features | Predictive Signal |
|---|---|---|
| Product telemetry | Core feature use, workflow completion, API activity, license utilization trends | Whether the customer is reaching value through the product |
| Engagement patterns | Login cadence, support ticket velocity, training attendance, meeting response | Whether participation is strengthening or weakening |
| Commercial signals | Payment history, contract structure, seat changes, expansion activity | Whether commercial friction or declining value is emerging |
| Organizational context | Stakeholder changes, company size, industry, champion status | Whether the customer's buying conditions or internal ownership have shifted |
Clean pipelines matter as much as feature selection. Duplicate accounts, inconsistent identifiers, missing event timestamps, and disconnected billing records can make a complex model learn operational errors instead of customer behavior. Teams should document a single account key, define event windows, and separate pre-churn information from data that only became available after cancellation.
Build features around customer decisions
Raw volume is usually weaker than meaningful change. “Sessions this month” tells you less than whether the customer still uses the workflow tied to its renewal objective. Useful engineered features include days since last core feature use, support ticket acceleration rate, license utilization trend, time since the last successful workflow, and the ratio of active users to purchased seats.
Time matters. A recent drop in core usage should generally carry more meaning than an old period of strong activity, so teams can use recency weighting or rolling windows. Cohort-relative benchmarks also prevent the model from treating a new customer like a mature account. A usage pattern that looks weak during onboarding may be normal for that stage, while the same pattern later in the lifecycle may indicate disengagement.
Interaction features expose relationships that individual fields hide. High login frequency combined with low workflow completion can indicate confusion rather than health. A rise in support tickets paired with declining feature use may indicate product friction. Stable usage alongside a change in the primary stakeholder can signal relationship risk that telemetry alone won't capture.
Keep feature definitions understandable. CSMs need to explain why an account entered a risk band, and product teams need to know which behavior they can change. If a feature can't support either an intervention or a diagnostic conversation, it may add complexity without adding operational value. For teams reviewing broader data quality practices, CRM data cleansing guidance can help establish the identity and consistency layer these features depend on.
Comparing Modeling Approaches From Logistic Regression to Ensembles
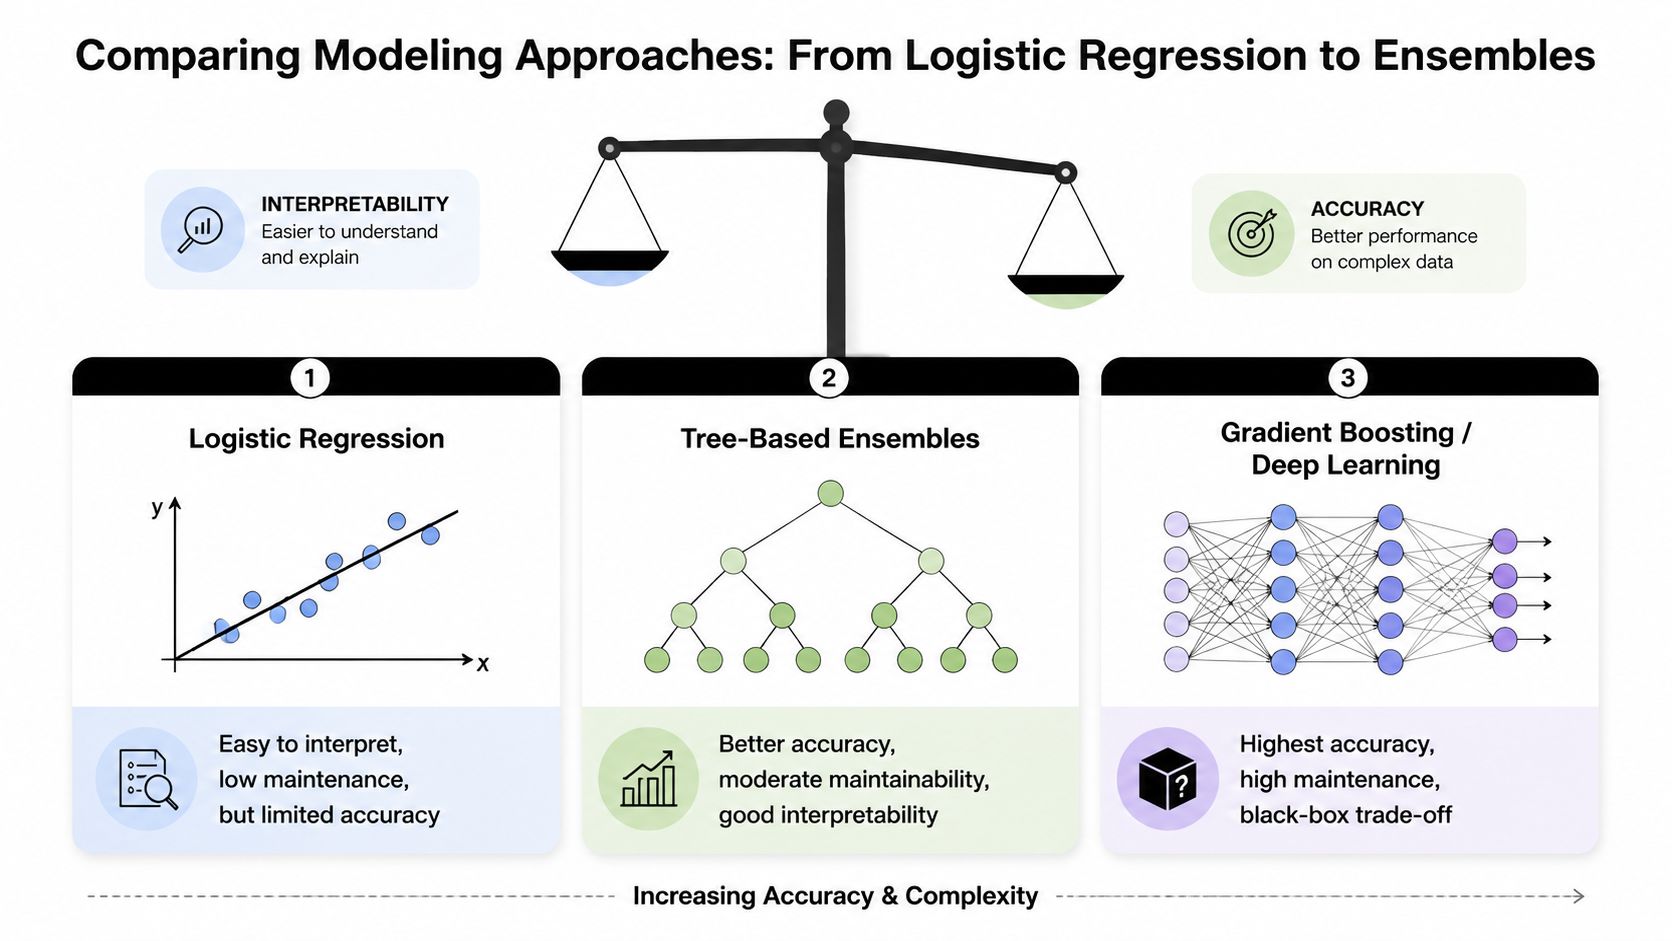
No single algorithm wins every SaaS churn problem. The right choice depends on data volume, event richness, stakeholder trust, retraining effort, and whether the business needs a ranked list or an estimate of time until churn.
Statistical models
Logistic regression remains a strong starting point for early-stage SaaS. It is transparent, inexpensive to maintain, and straightforward to explain to revenue leaders. Coefficients can show how directionally important a feature is, provided the team handles correlated variables, missingness, and scaling carefully.
Its weakness is limited flexibility. Customer behavior often includes nonlinear thresholds and interactions, such as risk appearing only when low adoption combines with an inactive champion. Logistic regression can represent those relationships, but the team must define the transformations and interactions deliberately.
Cox proportional hazards models answer a different question. Rather than only ranking whether an account may churn, survival analysis estimates how risk changes over time and can handle active customers whose eventual outcome is not yet known. That treatment of right-censored data makes survival analysis useful when intervention timing matters, renewal windows vary, or the team needs a hazard curve instead of a static label.
Tree ensembles
Random forests handle nonlinear relationships and interactions with less manual specification than logistic regression. They can serve as strong baselines for mixed SaaS data, although they may produce less intuitive probabilities and still require careful validation.
Gradient boosting often performs well when structured behavioral data contains subtle interactions. An explainable AI study reported metrics around 0.84 for accuracy, precision, recall, and F1 across XGBoost, LightGBM, and Gradient Boosting, while XGBoost achieved the strongest AUC-ROC of 0.932, according to this open-access churn explainability study. The operational lesson is important. A model can rank risk effectively even when raw accuracy isn't the headline metric.
Choosing complexity deliberately
Ensembles earn their complexity when the product generates rich telemetry, the retention team can act on ranked risk, and the organization can monitor drift. They don't earn it when feature definitions are unstable, labels are unreliable, or nobody can interpret the reasons behind a high-risk score.
Benchmarking also argues against declaring a universal winner. One telecom ensemble study reached 93.63% ROC-AUC, with 85.44% accuracy, 85.48% F1, churn precision of 85.19%, and recall of 85.79%, as reported in the Ghent University churn-modelling research. For a B2B team, balanced ranking and usable explanations may matter more than a marginal gain from a black-box architecture.
Evaluation Metrics That Align With Retention Economics
Accuracy answers whether predictions match labels across the full evaluation set. It doesn't tell you whether the highest-risk accounts are worth contacting, whether the probabilities are trustworthy, or whether an intervention caused an incremental save.
A retention team usually works with constrained capacity. CSM time, product support, executive attention, and commercial concessions are finite, so evaluation should reflect the slice of accounts the team can reach. Review precision and recall together, inspect top-segment lift, and evaluate performance at the operating threshold rather than only across every possible threshold.
Start with ranking, then test calibration
AUC-ROC is useful for ranking customers across thresholds. The explainable AI results cited above illustrate why this matters, since XGBoost's strongest reported result was on AUC-ROC rather than a dramatic separation across every classification metric. Still, AUC can hide weaknesses in the exact segment the team acts on.
Top-decile or top-bucket lift is closer to workflow reality. It asks whether the accounts at the top of the queue contain a meaningful concentration of future churners compared with a broader population. Precision protects the team from wasting outreach on healthy accounts. Recall measures how many genuine risks the team misses.
Calibration answers a separate question: when the model assigns a probability, does that probability correspond reasonably to observed outcomes? Calibrated scores help leaders allocate attention across segments and compare risk over time. A ranking model can be useful even when its probabilities aren't calibrated, but the CRM shouldn't present an uncalibrated score as if it were a literal likelihood.
| Metric | What It Measures | Business Limitation | When to Prioritize |
|---|---|---|---|
| AUC-ROC | Ranking quality across thresholds | May not reflect the acted-on customer slice | Comparing model discrimination |
| Precision | Share of flagged accounts that churn | Can miss many churners when the threshold is strict | Protecting scarce CSM capacity |
| Recall | Share of churners identified | Can create excessive outreach and false positives | Broad risk detection |
| F1-score | Balance between precision and recall | Treats errors symmetrically, unlike most businesses | Comparing classification trade-offs |
| Top-segment lift | Concentration of risk in the prioritized group | Depends on capacity and segment definition | Designing intervention queues |
| Calibration | Reliability of predicted probabilities | Doesn't prove an intervention causes retention | Allocating budgets and attention |
Measure incremental retention, not just risk
The key distinction is between propensity and uplift. Propensity models identify customers likely to churn. Uplift models estimate which customers are more likely to stay because of a particular intervention. A high-risk customer may be unsavable, already committed to leaving, or unaffected by a discount. Another customer may have moderate risk but respond strongly to training or product guidance.
Use holdout groups when possible, and compare outcomes for customers who receive an intervention with a similar group that doesn't. Qini curves and AUUC can help assess whether the model identifies customers with incremental treatment impact, rather than merely identifying customers who were going to churn.
Revenue teams should also track intervention cost, concession cost, retained value, and operational time. The broader objective is to improve customer lifetime value, so teams can connect model performance to customer lifetime value strategy rather than treating AUC as the final business result.
Connecting Risk Scores to CRM Automation and Interventions
A churn score becomes useful when it enters the system where customer work already happens. That may be Salesforce, HubSpot, Gainsight, or a customer data platform that synchronizes account state with downstream tools.
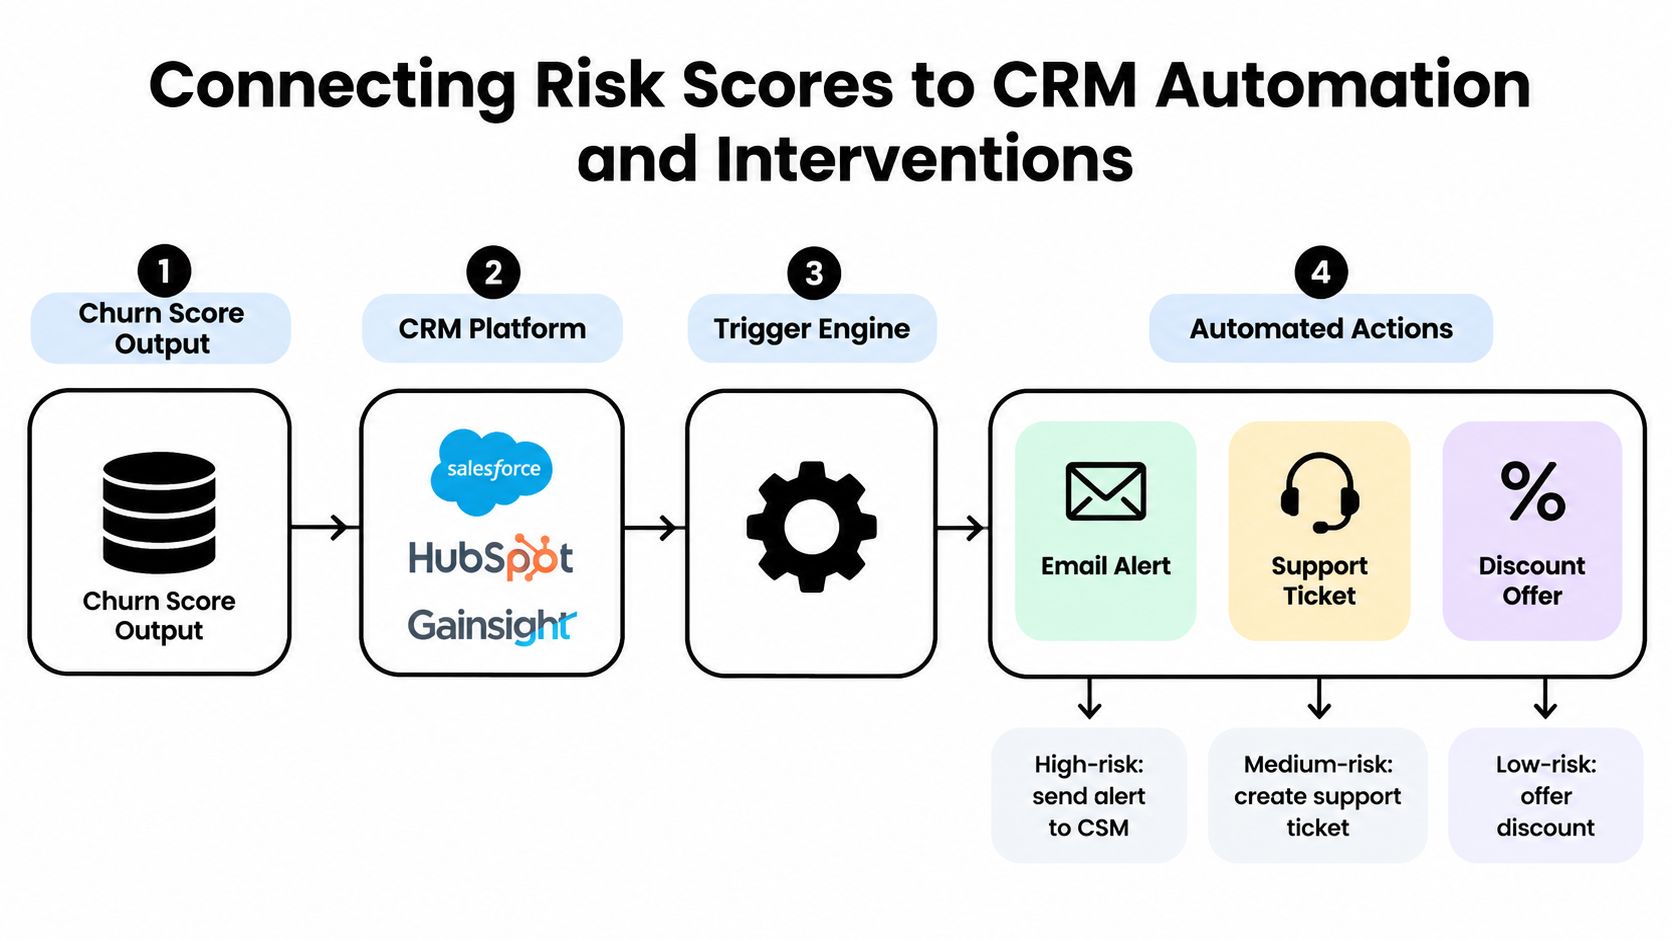
The integration should carry more than a numeric score. Send the risk band, scoring timestamp, leading drivers, affected product area, recommended playbook, assigned owner, and next review date. Without that context, the CSM has to open several systems before deciding whether the alert deserves attention.
Design risk bands around capacity
Avoid choosing thresholds because they look statistically neat. Choose them based on how many accounts the team can investigate and how much outreach the business can support.
A practical structure might include:
- Critical risk: Create an immediate CSM task, attach the key behavioral changes, and route enterprise accounts for account-manager or executive review.
- Elevated risk: Start a focused playbook, such as a usage review, enablement sequence, or support investigation, with a defined response window.
- Watch status: Continue monitoring and trigger contextual education or low-touch messaging instead of creating a human task.
- No action: Suppress repeated alerts when the account is already in an active renewal process, has an open escalation, or received the same intervention recently.
The intervention must match the cause. A payment issue should route toward billing recovery. A stalled workflow may need in-app guidance or technical support. A new champion may need re-onboarding. A strategic account with declining executive engagement may need relationship repair, not an automated discount.
Choose the right delivery pattern
Batch scoring works well for scheduled account reviews and routine CRM synchronization. API-based scoring is more appropriate when an event should trigger an immediate response, such as a failed setup workflow or a billing problem. Webhooks can pass the event to a trigger engine, which then creates a CRM task, starts an email sequence, or opens a support ticket.
Bidirectional sync closes the operational loop. The CRM should return whether the CSM contacted the customer, which playbook was used, whether the customer responded, and what outcome followed. Teams can use CRM automation practices to connect these events without forcing every handoff through manual spreadsheet work.
A retention workflow isn't complete when the alert is delivered. It's complete when the business records the action and its outcome.
That outcome data supports better evaluation and eventually uplift modeling. It also exposes a common failure: a team can generate more alerts without increasing meaningful customer conversations. Monitor completed interventions, response quality, time to action, and customer outcomes alongside model metrics.
Deployment Monitoring and Real-World SaaS Use Cases
Churn models are vulnerable to changes in the product and the customer journey. A feature redesign can alter event definitions. A new onboarding flow can change the meaning of early engagement. A pricing or packaging change can make old commercial features less informative.
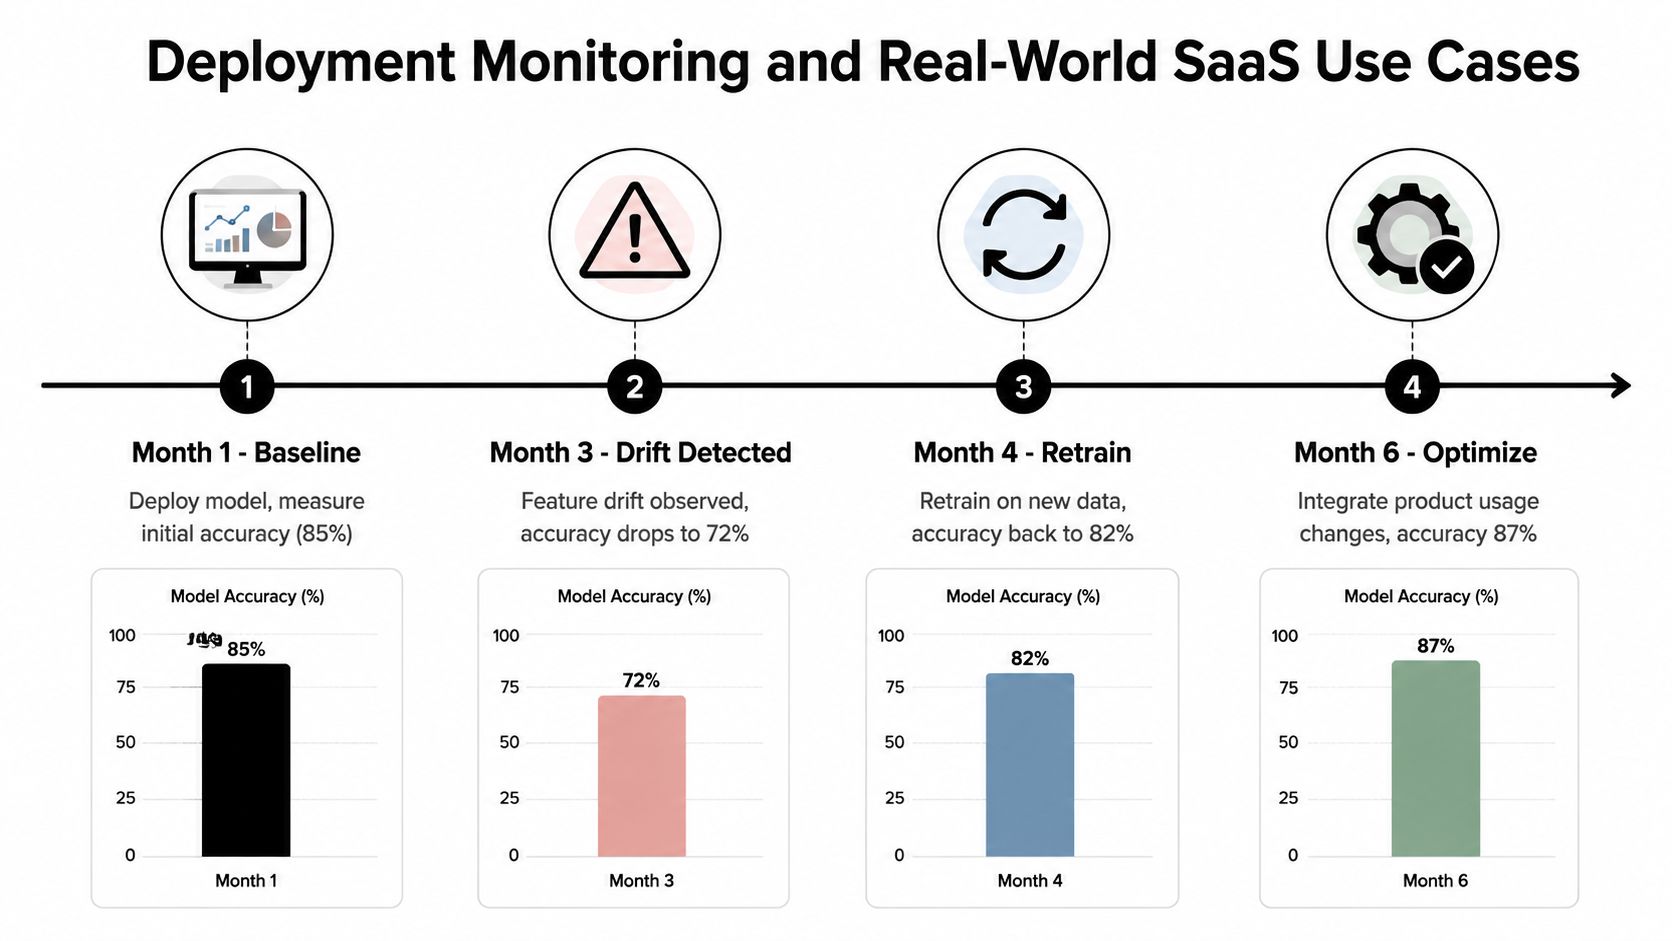
Consider a growth-stage SaaS company that changes its onboarding sequence. The old model interprets completion of a particular setup step as a strong health signal. After the redesign, that step is optional, while a different workflow now indicates activation. The model may continue producing plausible scores even though its most important feature no longer represents customer value.
Monitor three separate failure modes
Feature drift occurs when input behavior changes. Track distributions for login cadence, API activity, feature adoption, support volume, and commercial fields. A shift doesn't automatically mean the model is broken, but it should prompt investigation.
Prediction drift appears when the proportion of accounts in each risk band changes unexpectedly. A sudden increase in critical risk may reflect a genuine product problem, a tracking error, or a changed scoring pipeline.
Outcome lag complicates evaluation because churn labels arrive after the prediction. Keep a measurement window that links each score to its eventual renewal, cancellation, downgrade, or continued activity, and don't judge a model before enough outcomes have matured.
A monitoring dashboard should place these signals beside business measures such as save rate, intervention completion, renewal outcomes, and net revenue retention. The model can maintain stable technical metrics while the intervention process fails, or it can show drift while retention results remain stable because CSMs compensate effectively.
Test changes in production carefully
Use a holdout group when comparing intervention strategies or model versions. Keep assignment rules explicit, record the treatment each customer received, and avoid changing the threshold halfway through an experiment. If a product team fixes a broken workflow at the same time that customer success launches a new playbook, separate attribution may be difficult, but the organization should still document the combined change and its expected effect.
Retraining can follow a schedule, a drift alert, or both. Scheduled retraining provides predictability. Alert-based retraining responds faster to meaningful changes. Neither approach replaces feature governance, because retraining on broken or contaminated data only makes the wrong system more confident.
The video below provides an additional visual reference for deployment monitoring and operational model management.
A Practical Framework for Growth-Stage Retention Programs
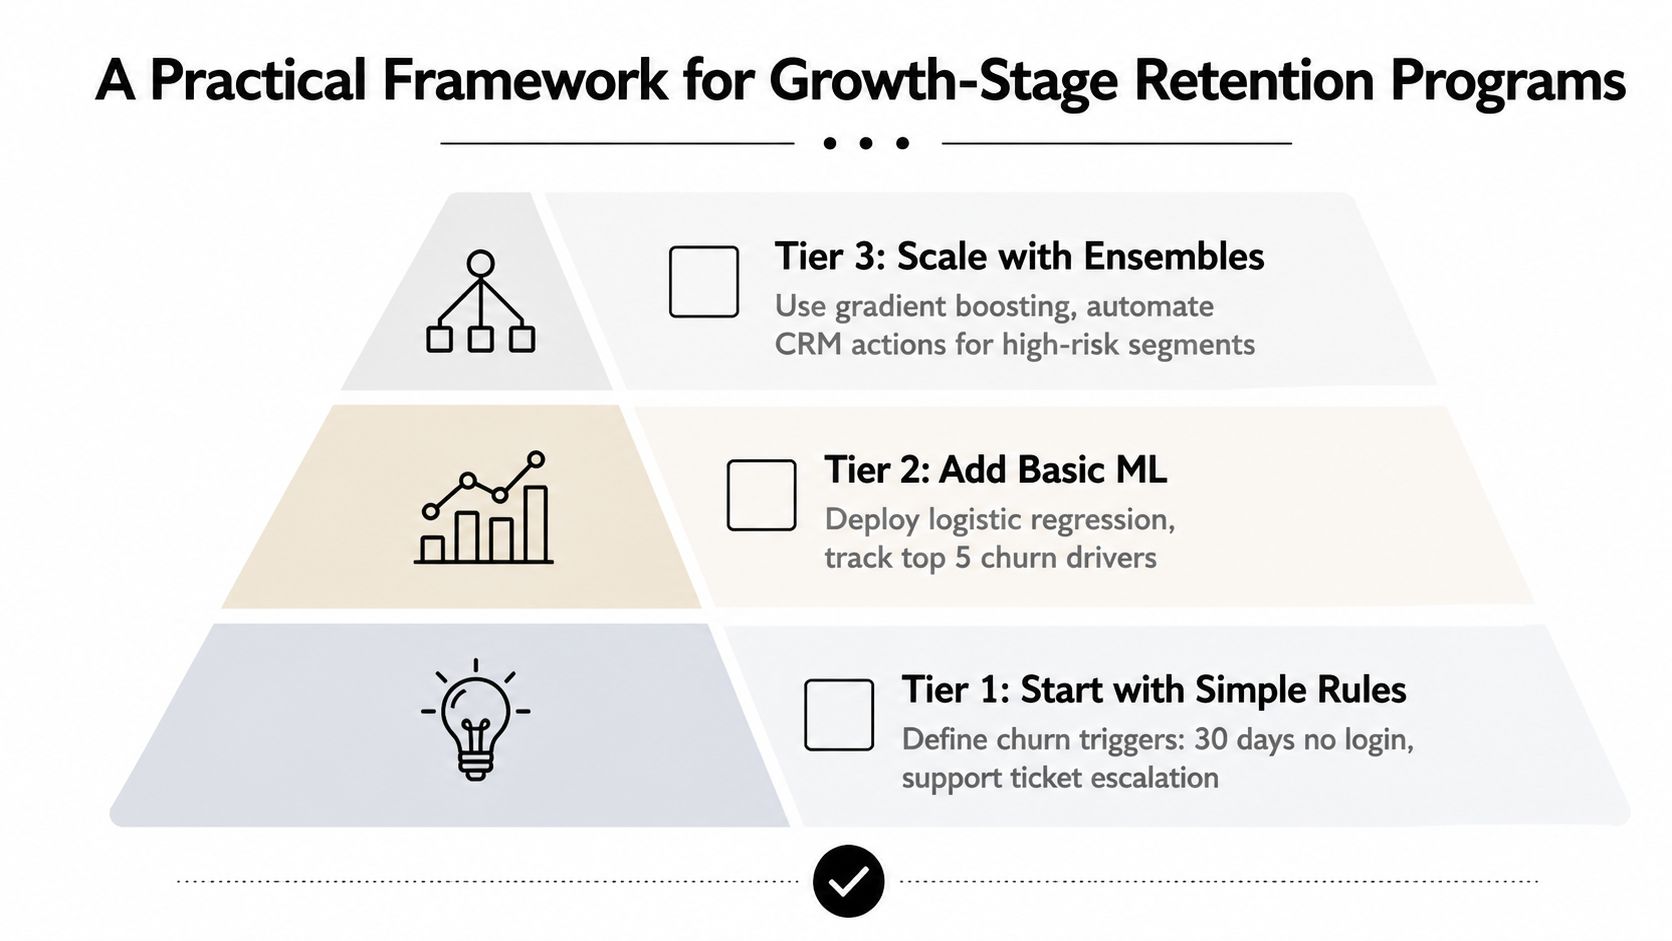
Growth-stage SaaS companies shouldn't begin with the most complex model they can deploy. They should begin with the clearest intervention they can execute and measure.
Start with operating discipline
Begin with rule-based risk signals tied to customer outcomes. Examples include a sustained loss of core workflow activity, unresolved support escalation, payment friction, or a stakeholder change that has not been followed by re-onboarding. Rules are easier to inspect and can reveal whether the team has enough data and intervention capacity to justify predictive modeling.
Then establish a baseline. Define churn, contraction, renewal, intervention, and save consistently across data, customer success, sales, and finance. Record which customers receive which actions, and create a control approach before increasing outreach.
A simple logistic regression model is often the right next step when the business needs transparent drivers and dependable maintenance. Move to ensembles only when richer telemetry, stable labels, and demonstrated operational use justify the additional complexity.
Graduate when the workflow is ready
The research literature continues to identify black-box limitations, weak external validation, class imbalance, and computational cost as unresolved issues. Recent work is also moving toward SHAP-based explanations, sequence-aware models, transformer-style architectures, and conformal uncertainty quantification, as summarized in this review of current churn-prediction research gaps. Those techniques can improve trust and context, but complexity won't compensate for unclear ownership.
Use a readiness checklist:
- Data audit: Confirm account identity, event timestamps, billing linkage, outcome labels, and leakage controls.
- Health definition: Document the product behaviors and business conditions that represent customer value.
- Playbook ownership: Assign an accountable owner for every risk tier and intervention type.
- Capacity threshold: Set alert volume according to actual CSM and support capacity.
- Measurement design: Track treatment, response, renewal outcome, and control status.
- Model gate: Require stable validation and useful explanations before introducing a more complex algorithm.
Customer feedback strengthens this loop when teams route it to the right owner and record what changed afterward. A practical guide to managing feedback for agencies is relevant for any service organization that needs to turn recurring complaints into operational signals rather than isolated notes.
MakeAutomation can help B2B and SaaS teams connect data, CRM workflows, proactive communication, and feedback loops so churn risk leads to defined actions rather than another dashboard.
MakeAutomation helps B2B and SaaS companies design and implement AI-powered workflows for churn prediction, CRM automation, proactive customer communication, and feedback tracking. Visit MakeAutomation to discuss a retention workflow that your teams can execute, measure, and improve.