Agent Productivity Playbook for B2B and SaaS Teams
Your team says it's busy. The queue keeps growing anyway. Sales reps spend calls searching for product details, support agents re-enter the same information across systems, managers add approval steps, and customers wait while every handoff creates another delay.
That isn't an agent productivity problem caused by a lack of effort. It's an operating model problem. Many teams measure activity because activity is easy to count, then wonder why faster work produces more rework, escalations, and disappointed customers.
The right question is not, “How quickly did the agent complete the task?” It's, “How much valuable customer or revenue work did the team complete per staffed hour, at an acceptable quality and cost?” AI can help answer that question, but only when leaders define the work, instrument the process, and govern the outcome.
What Agent Productivity Means in 2026
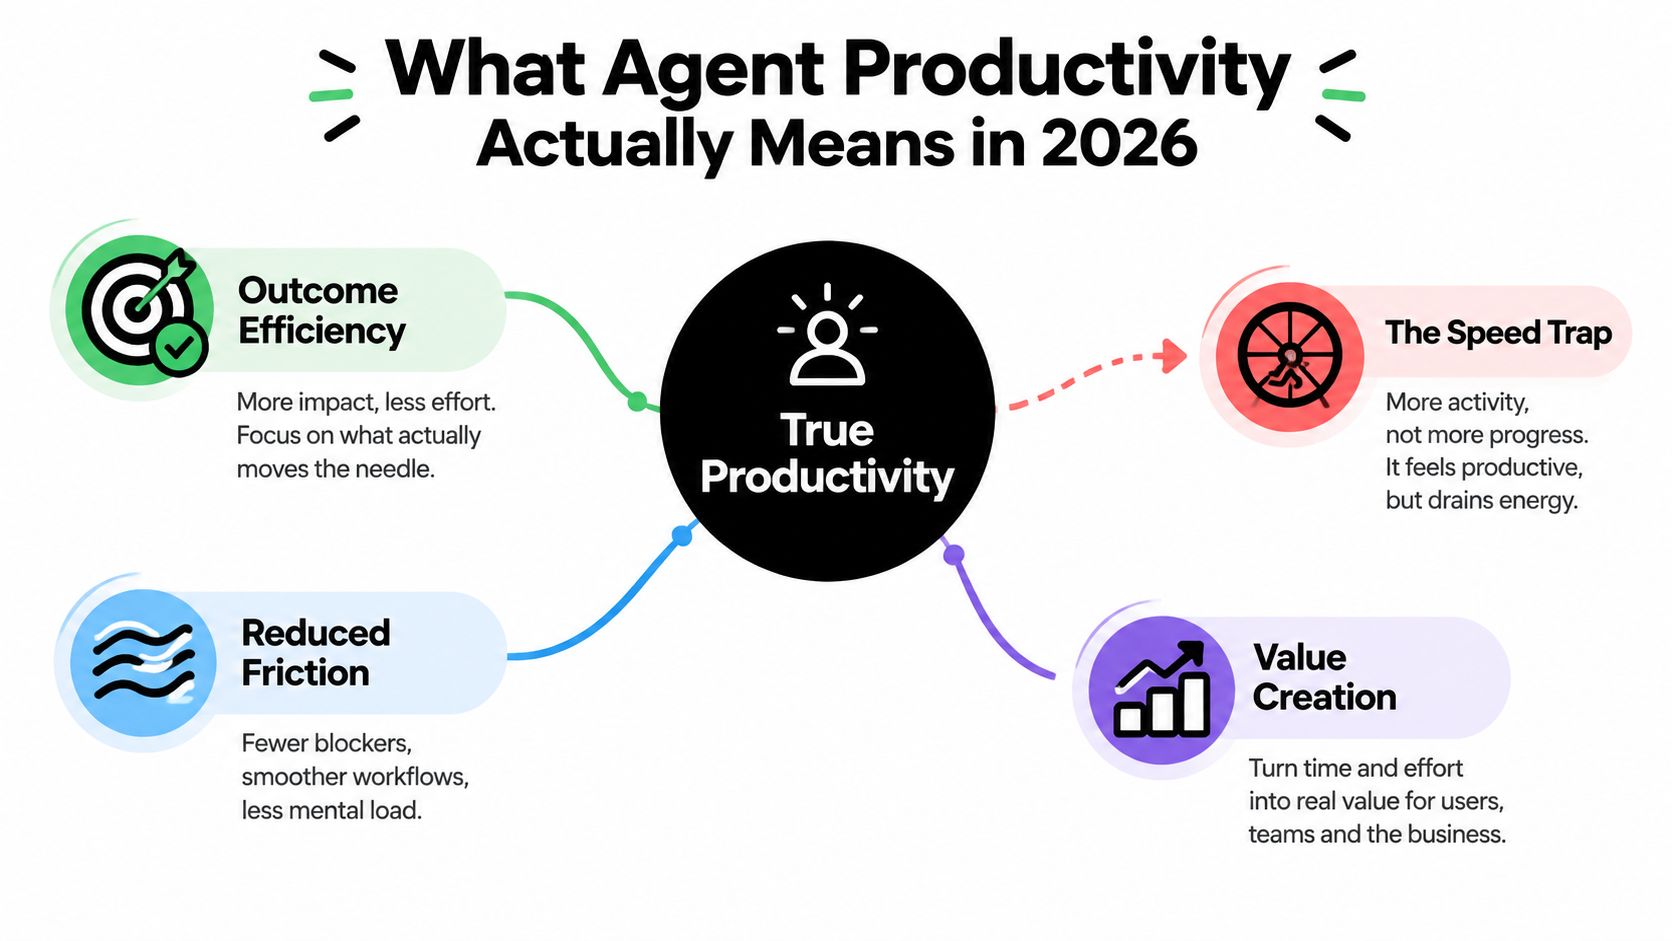
Agent productivity is the balance of throughput, quality, and cost across the full work cycle. Throughput measures outcome-producing work completed. Quality covers resolution, customer experience, compliance, and commercial effectiveness. Cost includes labor, software, rework, escalations, and the opportunity cost of unfinished high-value work. Govern all three together, or a faster workflow will create expensive cleanup.
Support teams should optimize resolved cases, not ticket closures. Sales teams should optimize qualified opportunities or productive meetings, not call volume. Voice AI should optimize successful outcomes and appropriate handoffs, not containment alone. A brief interaction that makes the customer repeat the issue is a failure disguised as efficiency.
Work completed per hour remains a useful anchor. A landmark study of 5,179 customer service agents found that generative AI assistance increased productivity by 13.8% overall, measured as issues resolved per hour. The same Stanford research found a 34% improvement for lower-skill agents, while the most experienced agents saw little change. Use that finding to segment your rollout. AI can reduce knowledge friction and narrow performance differences, but results will vary by agent, task, and workflow.
Stop rewarding speed in isolation
Average handle time and activity volume are useful diagnostic signals, not primary goals. Reward shorter calls alone and agents may rush customers, create follow-up tickets, or transfer difficult work. Reward closed-ticket volume alone and teams may close cases that later reopen.
Use a three-part scorecard:
- Throughput: accepted outputs divided by staffed hours.
- Quality: resolution without avoidable rework, plus CSAT, QA, compliance, and conversion measures where relevant.
- Cost: labor and tooling cost, plus rework and escalation burden created by the workflow.
Define each measure by cohort, channel, issue type, automation state, and tenure. A new support agent handling technical cases should not be compared directly with an experienced agent handling password resets. A slow-looking workflow may carry the most complex work.
Operating rule: Approve an AI rollout when completed outcomes per paid hour rise without breaching the quality floor. Faster task completion alone is insufficient.
The 2024 workplace benchmark offers another reference point. The paper reported a 15% average increase in issues resolved per hour after workers received AI assistance, as documented in the University of Tokyo working paper. Use that figure to frame a pilot, not to promise a result. Your baseline, task mix, quality controls, and adoption behavior determine the operational return.
The KPIs That Move Agent Productivity
A productive dashboard starts with a hierarchy. Frontline activity belongs at the bottom, operational efficiency sits in the middle, and customer or revenue outcomes belong at the top. If the numbers don't connect, managers end up optimizing disconnected tasks.
Throughput should be the primary efficiency family. For support, use tickets resolved per available hour, with a clear definition of what counts as resolved. For sales, use qualified opportunities or accepted meetings per selling hour. For contact centers, conversations completed and eligible cases resolved without transfer can reveal more than total contacts handled.
Latency measures explain where work slows down:
- First response time: time from case creation to the first meaningful agent response.
- Time to resolution: elapsed time from intake to an accepted outcome.
- Average handle time: active interaction time, used as a diagnostic rather than a standalone target.
- Queue wait time: time customers spend waiting before an agent or workflow takes ownership.
- Ramp time: the time new agents need to reach the team's defined performance and quality floor.
Quality controls prevent throughput from becoming a false win. Track CSAT, reopen rate, QA pass rate, compliance exceptions, escalation accuracy, conversion rate, and meeting quality according to the workflow. For first contact resolution, use a consistent formula:
FCR = eligible cases resolved without reopen or transfer ÷ total eligible cases
For general productivity, use:
Productivity = accepted outputs ÷ staffed hours
“Accepted” matters. A draft that requires extensive correction isn't equivalent to a customer-ready response. A meeting that lacks qualification isn't equivalent to a sales opportunity.
Build the scorecard around segmentation
Every KPI needs useful comparison fields. Segment by role, tenure, queue, channel, issue complexity, and automation state. Add skill level where the data supports it. The NBER benchmark of 5,172 customer-support agents reported a 14% average increase in tickets resolved per hour, with a 34% lift for the least experienced agents, as summarized in the field benchmark report. That pattern makes aggregate reporting dangerous. A team average can hide a failing experience for senior agents or a strong assist workflow for new hires.
| KPI | Formula | What It Reveals | Required Segmentation |
|---|---|---|---|
| Tickets per hour | Resolved eligible tickets ÷ staffed hours | Support throughput | Tenure, queue, issue type, automation state |
| Average handle time | Total handle time ÷ handled interactions | Interaction friction | Channel, issue complexity, agent cohort |
| CSAT | Positive survey responses ÷ total valid responses | Customer experience | Channel, issue type, agent cohort |
| First contact resolution | Cases resolved without reopen or transfer ÷ eligible cases | Resolution effectiveness | Queue, issue type, tenure |
| Conversion rate | Accepted conversions ÷ eligible sales interactions | Commercial effectiveness | Source, segment, rep tenure, workflow |
| Ramp time | Time to reach defined output and quality floor | Enablement effectiveness | Role, cohort, manager, training path |
Use a quality floor before volume rewards. You can weight outcome throughput most heavily, but keep quality visible and cost separate. A composite score that hides rework may look efficient while increasing the workload of QA teams and escalation specialists. Teams building an operating scorecard can also use this guide to define operational efficiency metrics consistently across departments.
Running a Productivity Audit Before Buying More Tools
Most stalled AI pilots began with a software decision instead of a workflow diagnosis. Leaders bought an assistant because agents were slow, then discovered the actual constraint was an approval policy, missing CRM data, unreliable routing, or an SOP nobody followed.
Run a focused audit before changing the stack. Choose one eligible journey, such as inbound demo requests, priority support cases, or billing-related calls. Define where the journey starts, what counts as a completed outcome, and which cases must be excluded.
Reconstruct the work as it happens
Pull the records needed to follow the customer through the process:
- Customer interactions: call recordings, transcripts, tickets, chat logs, and email threads.
- System events: CRM stage changes, dispositions, transfers, escalations, and approval timestamps.
- Quality evidence: QA reviews, compliance findings, reopens, refunds, and customer feedback.
- Operating context: staffing schedules, queue assignments, current scripts, and SOP versions.
Normalize timestamps and customer identifiers. Without that step, a single customer's repeated contacts can look like separate successful interactions. Overlay the workflow with tenure, cohort, queue, issue type, and automation state so you can distinguish a training problem from a routing problem.
Shadow agents across experience levels. Observe time spent searching for answers, waiting for approval, switching systems, rekeying data, escalating, and correcting AI-generated output. The point isn't to judge individual behavior. It's to expose friction the dashboard can't see.
Convert observations into an opportunity map
Create a bottleneck register with five fields: evidence, frequency, downstream impact, owner, and effort to fix. Rank the items that affect many cases, threaten quality, or prevent the team from scaling.
For each intervention, estimate value with a transparent model:
Recovered minutes × annual volume, plus avoided rework, escalations, or lost conversion
Keep the calculation directional if the underlying data is incomplete. The audit should tell you whether the root cause is an unclear policy, missing information, system latency, poor training, misaligned incentives, or purely repetitive work.
The result should be a ranked map:
- Low-risk assists, such as retrieval, summarization, and next-step suggestions.
- Augmentation projects, where AI drafts or recommends and an agent approves.
- Automation candidates, where the task is repetitive, reversible, high-volume, and governed by clear rules.
Audit standard: Don't automate a process that's broken, undocumented, and owned by nobody. Document the decision path first, then decide which parts software should perform.
Use the audit as the baseline for the business case and pilot comparison. The benchmark guidance from UpBench and related agent evaluation methods supports task-specific, outcome-based evaluation using representative real examples and blinded scoring. That approach is more useful than asking whether an agent “feels faster.”
Matching AI Interventions to Real Agent Tasks
AI deployment has three practical lanes: full automation, augmentation, and assist. Choose the lane based on risk, reversibility, data sensitivity, judgment required, and volume, not on what the model can technically do. The operating goal is a measured gain in throughput and quality, with a clear owner when the workflow fails.
Full automation fits narrow tasks with predictable inputs and recoverable errors. In support, that may include password resets, invoice re-sends, or FAQ triage. Voice workflows can handle identity-safe routing and simple status requests. Sales operations can classify inbound requests and create structured records when the rules are explicit.
Augmentation belongs in the middle. AI prepares a draft, summary, recommendation, or structured record, while a human owns the decision. Use it for objection-handling suggestions, ticket summaries, call notes, account research, and follow-up drafting. Track approval rates and rework, not just draft volume.
Assist mode suits high-judgment work. Complex deal qualification, sensitive escalations, renewal risk, legal questions, and technical diagnosis require human accountability. The agent can retrieve context and surface options, but it should not make irreversible decisions.
| Task Class | Recommended Lane | Risk Level | Volume Signal | Example Use Case |
|---|---|---|---|---|
| Repetitive, rule-based request | Full automation | Low | High | Password reset or invoice re-send |
| Structured classification | Full automation | Low to medium | High | FAQ triage or inbound lead routing |
| Drafting and summarization | Augmentation | Medium | Medium to high | Ticket summary or discovery-call notes |
| Recommendation with approval | Augmentation | Medium to high | Medium | Objection response or next-best action |
| Complex diagnosis | Assist | High | Low to medium | Technical escalation |
| Sensitive commercial decision | Assist | High | Low | Enterprise qualification or renewal intervention |
Use this routing rule: high-volume and low-risk goes to automation; high-judgment and lower-volume goes to assist; the middle goes to augmentation. Give agents an explicit fallback, log every handoff, and make the transfer visible to the customer and receiving team. Those controls matter as much as the model's response speed.
A SaaS support team may want to move a narrow Tier-1 category into automation. Publish the result as a success story only after measuring it against the agreed baseline. The objective is to return human capacity to technical escalations, not to maximize automated interactions.
Teams coordinating multiple workflows should define ownership, permissions, evaluation, and handoff logic before adding more agents. A practical introduction to how to manage multiple AI agents can help operations leaders design that coordination layer. For implementation planning, AI for operational efficiency offers a framework for connecting interventions to measurable workflow outcomes.
Dashboards and Monitoring Loops That Catch Drift
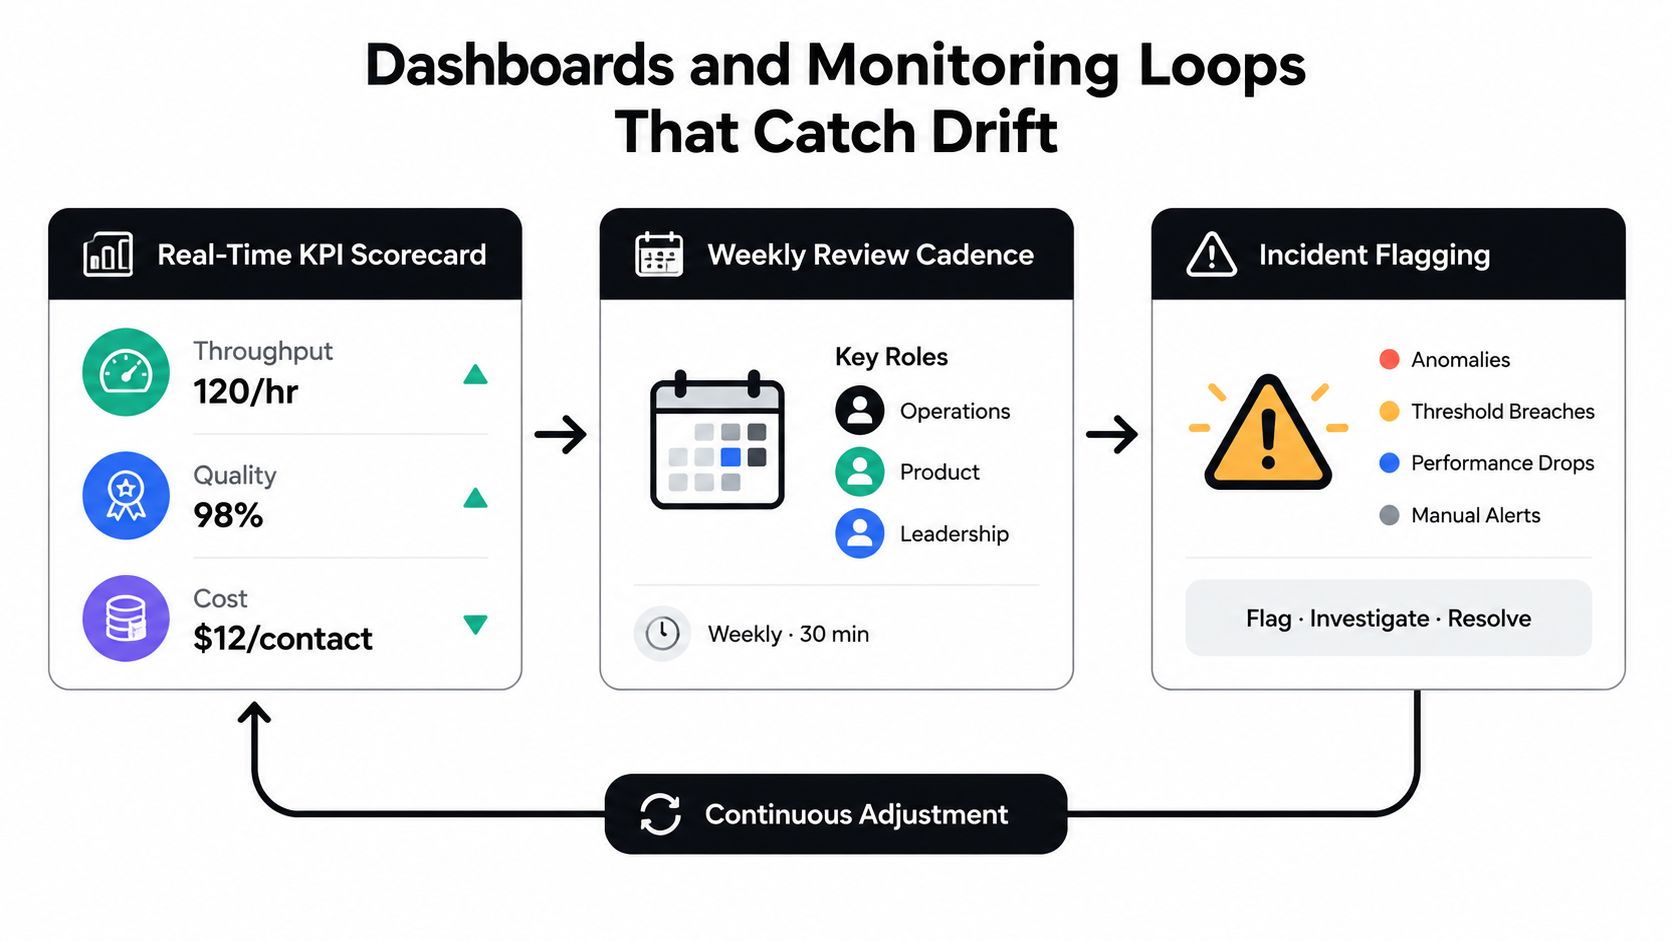
A dashboard isn't a monitoring system. It's only one surface in a monitoring loop. Productivity decays when ownership disappears, prompts change without review, knowledge sources go stale, or agents route difficult cases into manual queues.
Build three layers.
Real-time scorecard
Show throughput, quality, and cost by workflow and cohort. For support, include tickets resolved per staffed hour, FCR, reopen rate, CSAT, escalation accuracy, and rework. For sales, include accepted meetings, qualification quality, conversion, follow-up completion, and opportunity progression. For voice AI, include successful outcomes, escalation quality, intent accuracy, and failed handoffs.
Don't invent universal alert thresholds. Set them from your baseline, risk tolerance, and service commitments. The alert should state the metric, affected cohort, comparison window, owner, and required action.
Weekly operating review
Bring together the operations lead, QA owner, team manager, data owner, and AI workflow owner. Review trends, not isolated anecdotes.
A practical agenda looks like this:
- Baseline comparison: What changed in throughput, quality, and cost?
- Cohort movement: Which tenure, queue, or issue group improved or regressed?
- Failure review: Which outputs caused rework, escalation, or customer confusion?
- Change log: What prompt, SOP, model, routing, or data change occurred?
- Decision register: What gets fixed, paused, expanded, or tested next?
Use dashboard design references such as these real world sales dashboard examples to make the view useful for decisions, not decorative reporting.
Incident loop
Flag hallucinations, CSAT deterioration, unexpected routing, compliance exceptions, and handle-time regressions quickly. Assign a severity, freeze risky changes when necessary, identify the root cause, and record the corrective action. Then monitor the affected cohort until performance returns to the defined range.
Governance principle: Every important metric needs an owner, every alert needs a response, and every response needs a record.
Without the weekly meeting and incident log, dashboards become wallpaper. The loop protects gains after the pilot team stops paying special attention.
SOPs, Scripts, and Prompt Libraries That Compound Gains
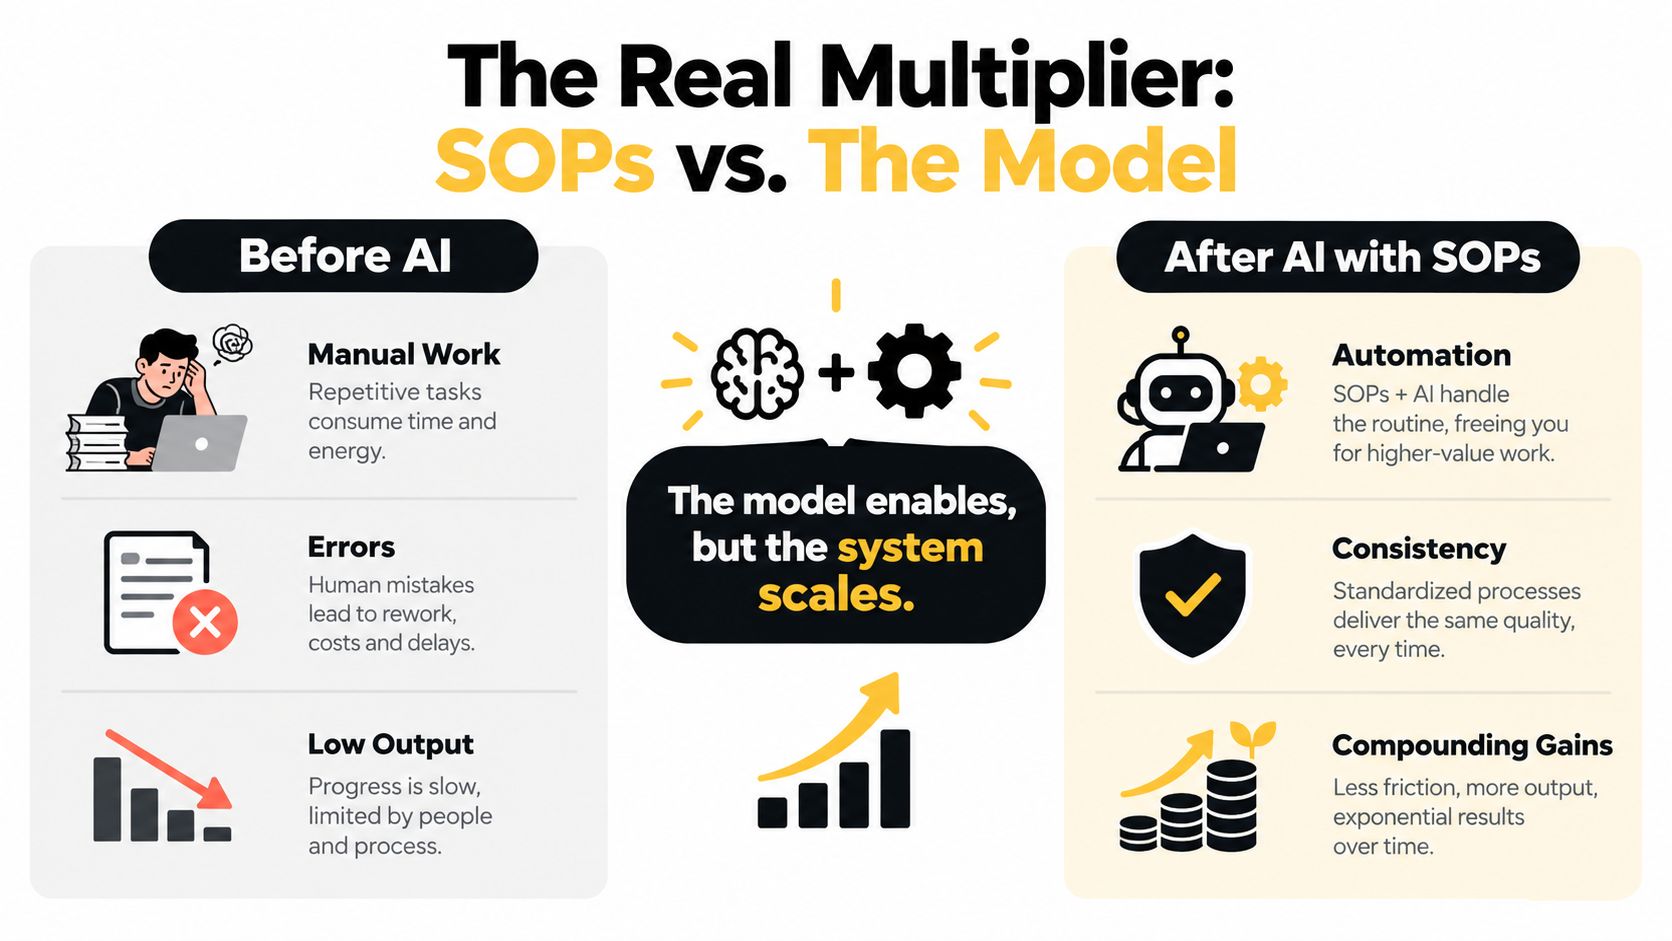
The model isn't the productivity multiplier. The operating system around the model is. A capable AI agent still produces inconsistent work when the inputs are vague, the handoff rules are missing, and nobody knows which version of the process is current.
Compare these prompts:
- Weak: “Summarize this discovery call.”
- Strong: “Summarize the call for the account executive. Extract business problem, current process, affected stakeholders, stated timeline, objections, competing tools, commitments, and unanswered questions. Mark unsupported assumptions as unknown. End with the next action, owner, and due date.”
The second prompt defines the audience, fields, uncertainty behavior, and output format. That makes the result easier to review and easier to measure.
For a refund response:
- Weak: “Write a refund email.”
- Strong: “Draft a concise customer response using the approved refund policy. State what is eligible, what information is missing, the next action, and the expected owner. Don't promise approval. Route exceptions to the billing queue and include the policy reference for QA.”
For lead qualification:
- Weak: “Qualify this lead.”
- Strong: “Classify the lead using the approved qualification fields. Separate confirmed facts from inferred details, identify the business problem, current solution, buying role, urgency, and next step. If a required field is missing, ask one question instead of guessing.”
Make every SOP executable
Use a consistent structure:
- Trigger: What event starts the process?
- Owner: Which person or agent is accountable?
- Inputs: Which systems, records, and documents are authoritative?
- Steps: What happens in order?
- Fallback: When must the workflow stop or escalate?
- Quality check: What evidence proves the output is acceptable?
When AI handles Tier-0 or Tier-1 work, the handoff script must carry context forward. Include the customer's stated intent, completed actions, failed attempts, relevant account details, and the reason for escalation. Don't transfer a customer with a blank transcript and a generic note.
Tie each artifact to a KPI. A summarization SOP should affect documentation time, rework, and CRM completeness. A qualification prompt should affect accepted meeting quality and conversion. A handoff script should affect escalation accuracy and repeat contact.
Teams that need a repeatable documentation workflow can use a structured SOP development process to keep ownership and review requirements visible.
The maintenance rhythm matters. Review prompts monthly, audit SOPs quarterly, and keep one source of truth. If sales, support, and the AI workflow each maintain separate versions, the team will eventually optimize different processes under the same name.
The model enables the task. The system scales the result.
A 90-Day Rollout Plan for B2B and SaaS Teams
A rollout succeeds when it produces operating evidence, not merely positive user feedback. Assign one owner for the business outcome, one for the AI workflow, and one for quality. Keep the pilot narrow enough to explain every change, trace every exception, and connect results to a defined KPI.
Days 1 to 30 establish the baseline
Set KPI definitions before anyone changes the workflow. Define eligible cases, accepted outputs, staffed hours, quality floors, cost categories, and segmentation fields. Complete the productivity audit, record the top five bottlenecks, and select two pilot workflows. Choose one for assist or augmentation and one for narrow automation.
Create a baseline dashboard, bottleneck register, current SOPs, pilot acceptance criteria, and escalation policy. Vague measurement is the first failure mode. If “productivity” still means busy time or agent sentiment alone, stop the pilot and fix the definitions.
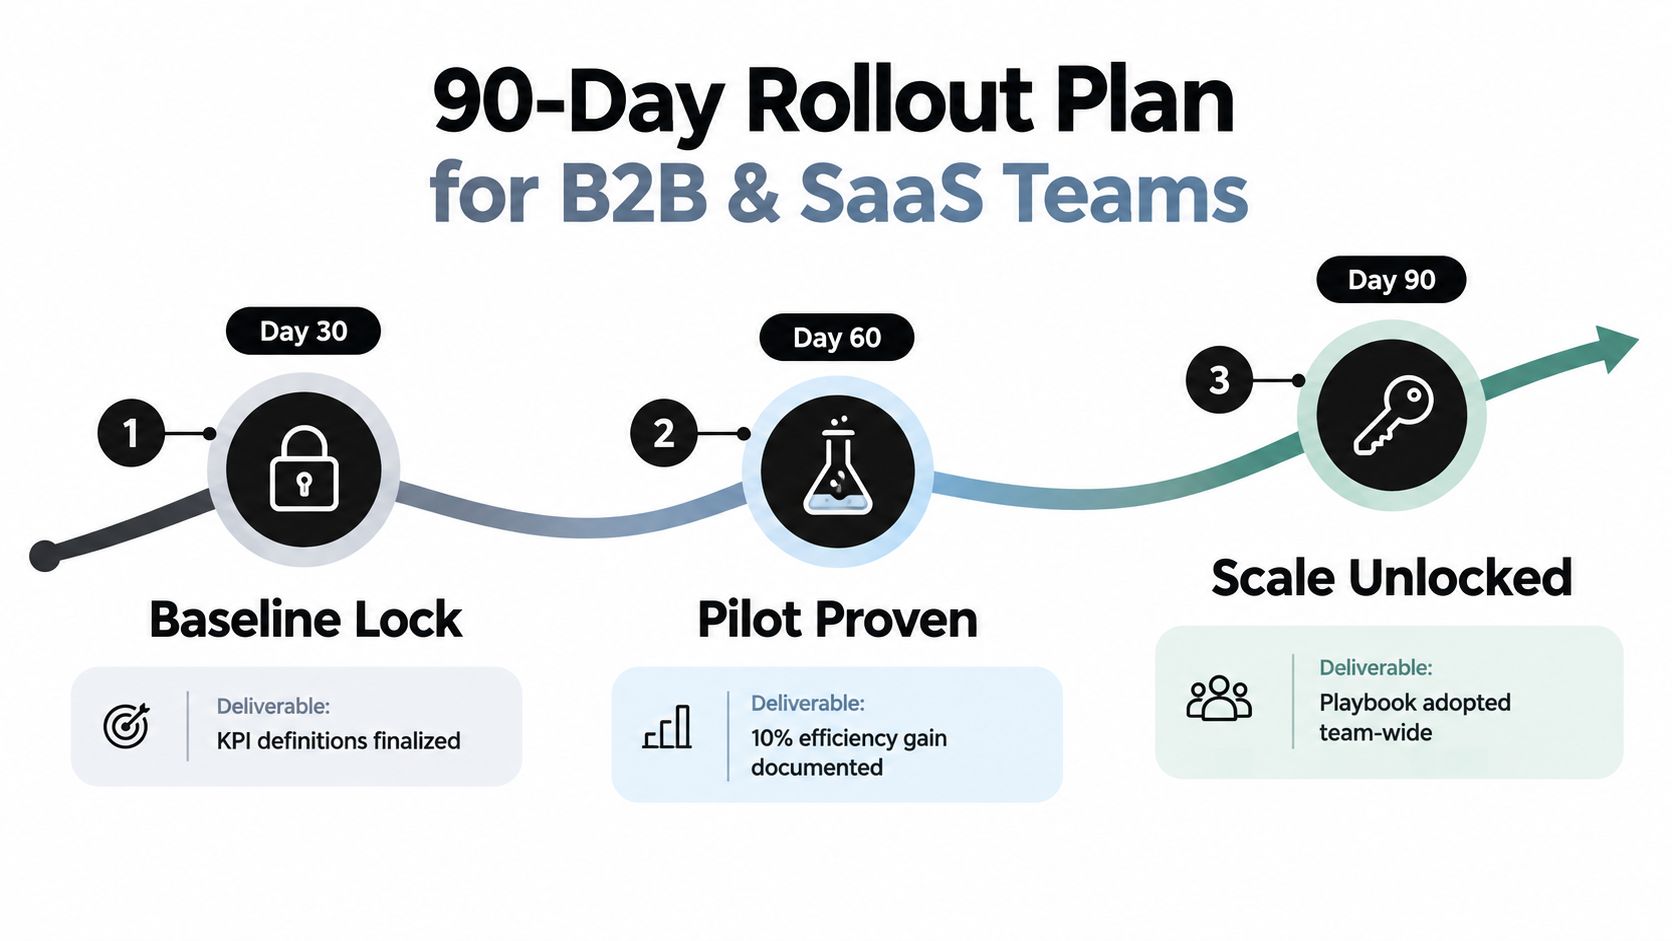
Days 31 to 60 deploy with control
Launch assist-mode AI in one lane and full automation in one narrow, reversible lane. Instrument the dashboard before expanding access. Run weekly quality reviews, sample outputs from each cohort, and log every prompt, routing rule, SOP revision, and data change.
Give agents a clear correction path. They must be able to report a bad recommendation, missing context, or failed handoff without creating a separate workaround. Otherwise, the pilot produces weak learning and hides recurring defects.
Scope creep is the main risk during this phase. Do not add queues because the first workflow looks promising. Prove the original use case, its quality floor, and its operating cost before expanding.
Days 61 to 90 scale only what holds
Expand winning lanes, retire failing ones, formalize the prompt library, and publish the approved SOP. Tie results to quarterly OKRs, staffing decisions, enablement plans, and service-level commitments. Keep cost and quality visible in every business-case review.
The final checkpoint should answer four questions:
- Outcome: Did accepted outputs per staffed hour improve?
- Quality: Did the workflow remain above its defined floor?
- Economics: Did recovered capacity exceed tooling, oversight, and rework costs?
- Governance: Can another team operate the workflow using the documented SOP?
Dashboard blindness becomes the month-three failure mode. Teams celebrate launch, stop reviewing cohorts, and discover drift only after customers complain. Put the weekly review on the operating calendar before the pilot ends, with a named owner and a recorded decision.
The ROI gap requires equal attention. A 2026 industry benchmark of AI agent deployments reported that only 41% of agent rollouts reached positive ROI within 12 months, while 19% never paid back, according to the benchmark summary on agent productivity and ROI. Adoption is not value. Frontline time savings can disappear into QA, compliance review, rework, or a workflow that does not fit the process.
Use the rollout to prove durable value, not just faster execution. MakeAutomation turns an agent productivity baseline into a governed implementation plan, covering workflow mapping, SOP development, AI automation, and voice AI deployment. Start with a measured pilot rather than another tool purchase.