

Cost Benefit Analysis Framework for AI and Automation
A precise ROI number is often the least reliable part of an AI business case. The spreadsheet may calculate perfectly while resting on guesses about adoption, labor displacement, integration effort, exception rates, and the time needed for benefits to appear. A strong cost benefit analysis framework doesn't hide that uncertainty. It makes uncertainty visible enough for leaders to decide whether to proceed, test, redesign, or stop.
That distinction matters because cost-benefit analysis has evolved from project accounting into a formal method for evaluating policy, infrastructure, and regulation. The early history includes the Abbé de Saint-Pierre's 1708 study, Jules Dupuit's 1848 work on infrastructure profitability, the US Federal Navigation Act of 1936, Executive Order 12291 in 1981, and Executive Order 12866 in 1993, which remains the core federal rulemaking standard today, as documented in this peer-reviewed history of cost-benefit analysis. Modern guidance treats CBA as a decision process, not a decorative ROI calculation.
Why Most AI Business Cases Fail Before They Start
The popular advice is to make the business case more precise. In practice, precision can make a weak analysis more dangerous. A model that displays a detailed payback period but cannot explain how its adoption assumption was established gives executives a false sense of control.
AI projects create unusually fragile assumptions. A sales team may not use an automated research workflow consistently. A voice agent may transfer difficult calls to humans, leaving the business with most of the labor cost and a new technology bill. A recruitment platform may reduce administrative work while increasing review time because recruiters need to validate more machine-generated recommendations. The formula doesn't cause these failures. The input logic does.

Replace false comprehensiveness with disclosed limits
A model becomes less trustworthy when its authors force every uncertainty into a single monetized estimate. A recent policy analysis argues for moving away from “false comprehensiveness” and toward explicit disclosure of model limits, deep uncertainty, and hidden judgments in cost-benefit modeling. The Bank of England's Prudential Regulation Authority has also highlighted evidence gaps and their effect on judgment in its CBA process.
That approach is especially relevant to B2B automation. Decision-makers need to know not only the projected benefit, but also whether the estimate comes from internal operating data, a vendor claim, a comparable workflow, a pilot, or an untested assumption. Those evidence types shouldn't receive equal confidence.
A practical model should attach a confidence label to every major driver:
- Observed: Supported by existing workflow or finance data.
- Benchmarked: Informed by a comparable process, but not yet validated internally.
- Inferred: Derived from an operational assumption or proxy.
- Speculative: Included to represent a possible upside, not a dependable forecast.
Practical rule: If removing one assumption changes the recommendation, that assumption deserves a pilot, not stronger formatting.
The best business case may therefore be weaker on paper. It may show a broad range, exclude unproven revenue upside, and separate hard savings from capacity benefits. That model gives the CFO a more useful question: which evidence would change the decision, and how cheaply can we obtain it?
The Staged Workflow Every Strong Analysis Follows
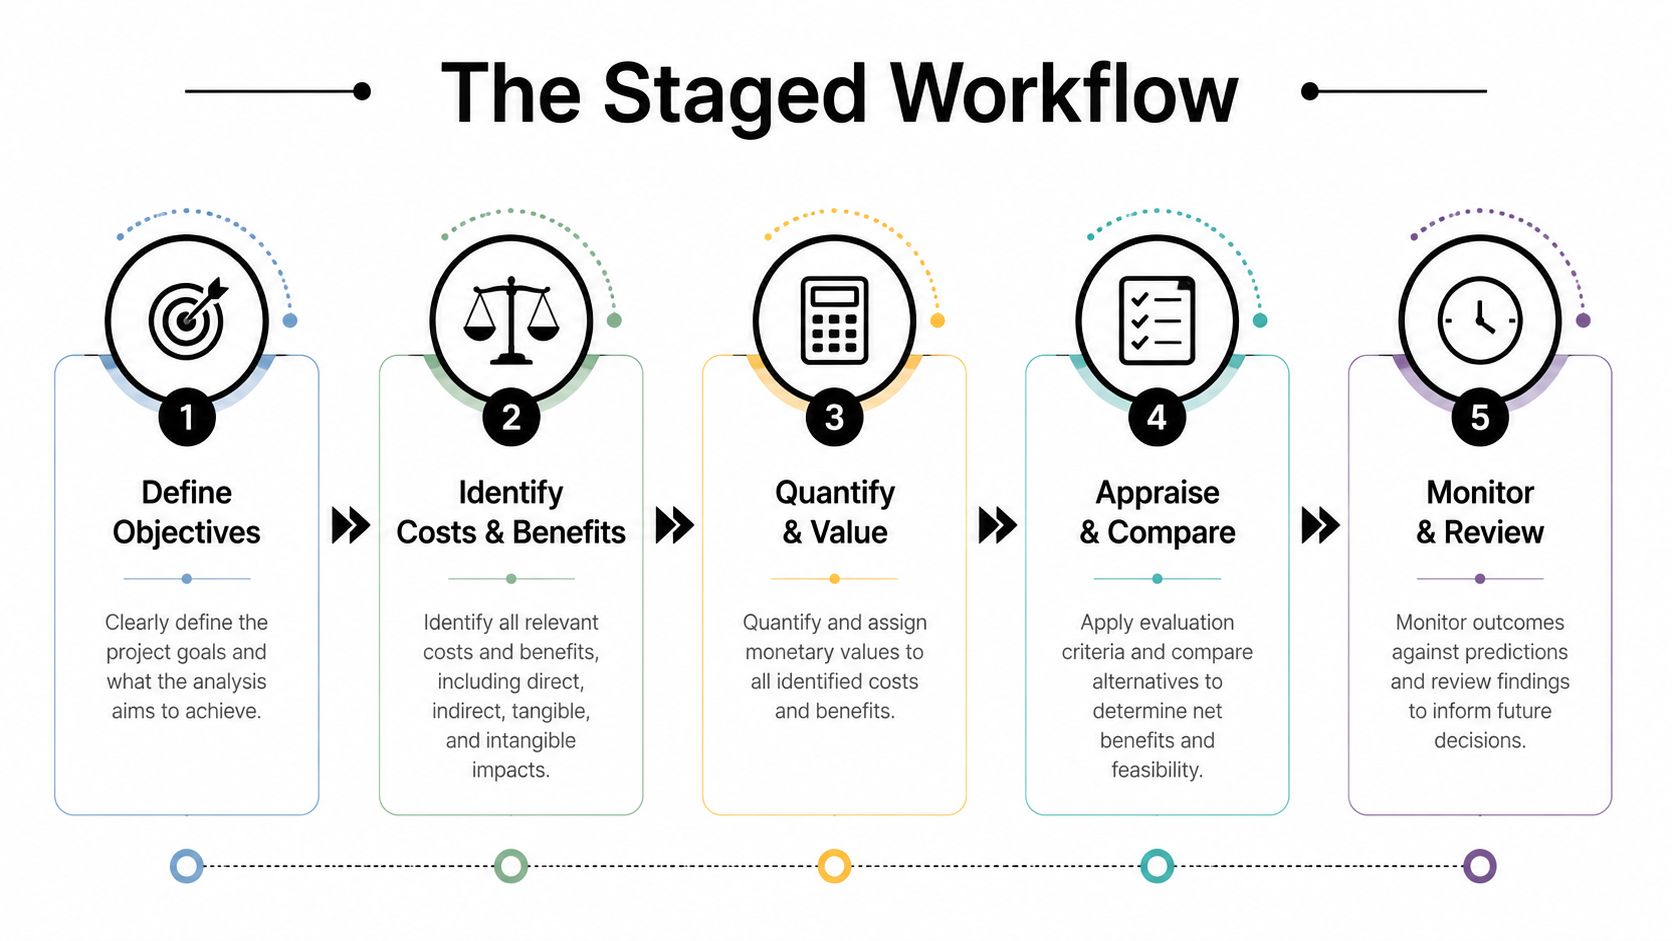
A reliable analysis is a sequence of decisions, not a polished spreadsheet assembled at the end. Public-sector guidance from the UK, Canada, and New South Wales emphasizes a base case, alternatives, valuation, comparison, sensitivity analysis, and monitoring. The NSW Government guide to cost-benefit analysis frames the work as a lifecycle, which matters because early assumptions often look more certain than the evidence supports.
Consider a B2B company evaluating an AI voice agent for inbound sales calls.
Start with the baseline
Define what happens without the investment. Record current call volume, response handling, staffing, transfer patterns, conversion stages, operating hours, and the cost of the existing process. “The team handles calls manually” is not a usable baseline. Describe the workflow that continues if leadership rejects the proposal.
Then define the counterfactual. Would the company hire another representative, extend coverage, improve routing, or accept slower response times? Comparing automation with an unrealistic do-nothing option can make projected value look larger than it is.
Specify alternatives before choosing a winner
Options might include retaining the current process, buying a voice platform, building a custom agent, or improving routing without adding AI. Give every option the same scope, time horizon, and treatment of costs and benefits. Otherwise, the preferred option may receive detailed costs while alternatives remain vague.
Document the decision owner, operational objective, excluded items, and assumptions register. If the proposed agent qualifies leads but does not answer pricing questions, that boundary belongs in the model. Evidence gaps should be visible at this stage, before a vendor demonstration turns an assumption into an apparent fact.
Identify, value, and time the impacts
List implementation, integration, training, oversight, and support costs. Identify benefits such as avoided work, faster response, improved routing, additional selling capacity, and fewer errors. Monetize only benefits that can be defended, and state the proxy when direct valuation is unavailable.
Timing can change the recommendation. Benefits may build as staff learn the system, workflows are redesigned, and exceptions are resolved. Costs often arrive first, so treating both as immediate can overstate early returns.
Compare with financial measures
Use NPV, BCR, and payback period to compare options. Keep cash effects separate from non-cash capacity benefits, and prevent double counting. If faster response improves conversion, do not also claim the full resulting revenue increase as a separate productivity benefit without explaining the distinction.
Stress-test, report, and monitor
Run sensitivity analysis on the assumptions driving most of the result. Report distributional effects as well. Automation may create value for the company while shifting work to sales managers, support staff, or compliance teams.
Use this video as supplementary workflow guidance, not as a substitute for documenting evidence, assumptions, and calculation choices.
Monitoring completes the framework. Assign an owner to each assumption, define the operating metric that will test it, and set the review point. A decision-ready analysis can change as call handling, transfer, adoption, and conversion data replace estimates. A narrower model with visible uncertainty is more useful than a polished forecast built on unsupported confidence.
Mapping AI-Specific Costs and Hidden Benefits
Generic capital-investment templates often understate the work around an AI system. The license or build cost is visible, but the operational burden sits elsewhere. Implementation may require workflow redesign, CRM integration, data cleanup, prompt or model configuration, access controls, testing, human review, and exception handling.
A defensible analysis also includes ongoing monitoring, retraining, security, compliance, support, and decommissioning. These aren't optional extras for a production workflow. They determine whether the system remains usable when data, policies, customer behavior, or internal processes change.
Benefits need the same discipline. Headcount reduction is only one possible outcome, and it may not be the most realistic one. An automation can create value by increasing throughput, reducing errors, accelerating response, improving consistency, enabling revenue work, or allowing an existing team to handle additional demand without proportional hiring.
A sales outreach workflow might research accounts, draft messages, update a CRM, and route replies. The benefit isn't automatically “fewer salespeople.” It may be more qualified activity from the same team, provided managers can verify quality and representatives adopt the workflow. In recruitment, automation may screen applications or coordinate interviews, but the value can come from reducing administrative friction while preserving human judgment for candidate evaluation.
The benefits of hyperautomation are easiest to defend when each benefit is tied to a specific operational constraint rather than described as broad transformation.
| Category | Type | Common Estimation Mistake | Example in B2B Context |
|---|---|---|---|
| Implementation and configuration | Cost | Treating setup as a one-time vendor fee | Mapping a CRM, call-routing logic, and approval workflow |
| Integration and data preparation | Cost | Ignoring cleanup and failed handoffs | Connecting a voice agent to CRM records and calendars |
| Monitoring and retraining | Cost | Assuming the model will remain accurate without ownership | Reviewing transcripts, updating intents, and correcting routing |
| Security and compliance | Cost | Leaving review with legal or IT as an unbudgeted task | Access controls, retention rules, and audit documentation |
| Decommissioning and transition | Cost | Assuming replacement will be costless | Exporting records and restoring a human workflow |
| Throughput | Benefit | Counting theoretical capacity as delivered output | More inbound inquiries handled during existing coverage |
| Error reduction | Benefit | Valuing every avoided error as direct cash savings | Fewer duplicate records or incorrect candidate statuses |
| Revenue enablement | Benefit | Claiming revenue without proving the causal path | Faster lead response creates more opportunities for sales follow-up |
| Capacity enablement | Benefit | Calling unused capacity a headcount saving | Recruiters handle more requisitions without immediate hiring |
| Resilience and consistency | Benefit | Assigning arbitrary value to a broad quality claim | Standardized intake when a key operator is unavailable |
A useful distinction is risk-adjusted productivity. Calculate the value of work the system is likely to improve, then discount it for adoption, exception handling, quality review, and ramp time. This is often more credible than assuming every saved hour becomes a cash saving.
For each benefit, ask four questions:
- Who receives it? Sales, operations, finance, customers, or another team?
- What changes operationally? Fewer touches, faster handling, fewer defects, or greater capacity?
- When does it appear? Immediately, gradually, or only after process redesign?
- What evidence supports it? Internal data, a pilot, a benchmark, or an untested hypothesis?
That structure prevents the common mistake of turning “the system can do this” into “the business will capture this value.”
Financial Metrics That Actually Inform Automation Decisions
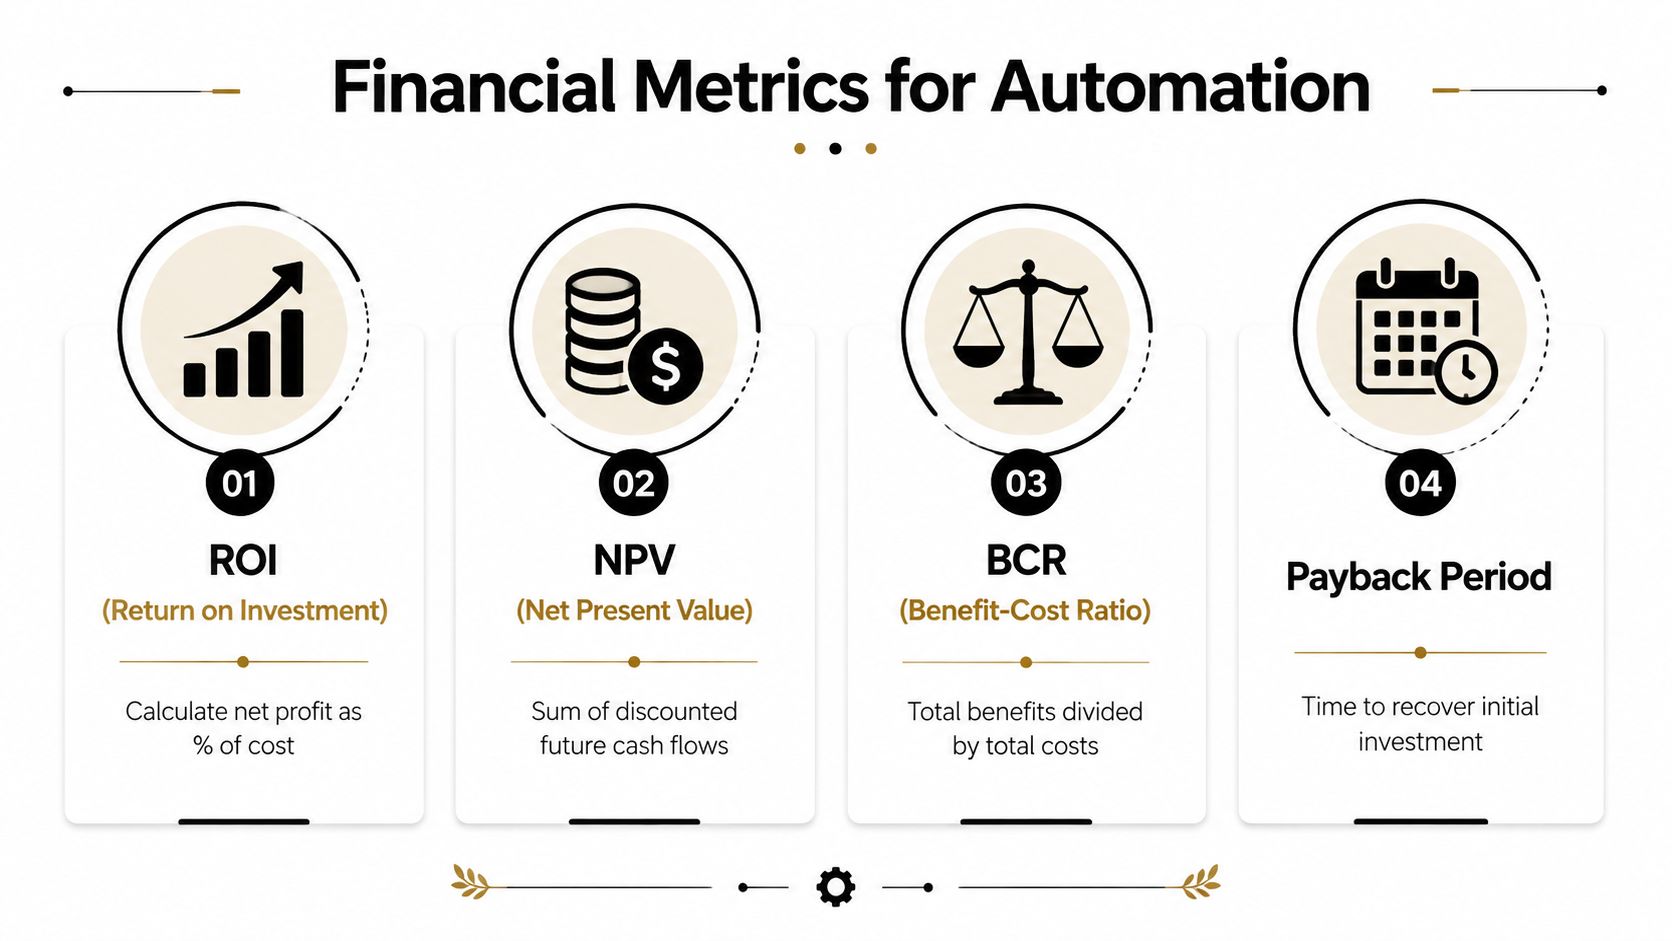
Each metric answers a different management question. ROI asks how much net value the project generates relative to its cost. NPV asks whether future cash flows create value after applying the organization's discount rate. BCR compares the present value of benefits with the present value of costs. Payback period asks how long the initial investment takes to recover.
Use formulas as decision tools, not as a ranking contest:
- ROI = net benefits divided by total costs.
- NPV = present value of benefits minus present value of costs.
- BCR = present value of benefits divided by present value of costs.
- Payback period = time required for cumulative benefits to recover the initial investment.
A simple CRM automation example can show the mechanics without pretending to forecast a real company. Suppose an initiative has an upfront cost of 100 units, ongoing costs of 20 units in each period, and benefits of 60 units in each period over three periods. At an illustrative discount rate of 10%, the present value of the benefits is approximately 149.21 units, while the present value of the ongoing costs is approximately 49.74 units. Total present-value costs are therefore approximately 149.74 units, producing an NPV of approximately negative 0.53 units and a BCR of approximately 1.00. These figures are an arithmetic example, not a market benchmark.
The example demonstrates why labels matter. A project can appear attractive when teams look only at undiscounted benefits, yet become marginal once timing and recurring costs are included. If benefits arrive later, a higher discount rate reduces their present value further. If benefits arrive quickly, the discount-rate choice has less influence.
Match the metric to the decision
Payback is useful when cash preservation matters. It can expose a project that eventually creates value but consumes too much cash before the organization sees results. It can also mislead by ignoring benefits after recovery.
NPV works well when comparing a multi-period platform build with incremental tool purchases. It recognizes timing and recurring costs, but the result depends on the discount rate and the quality of each cash-flow estimate.
BCR helps compare projects with different scales, especially where leadership is allocating a constrained budget. A high ratio doesn't automatically make a project preferable if its absolute value, strategic fit, or execution confidence is weak.
ROI communicates quickly, but it can hide timing, risk, and denominator choices. Teams should explain whether costs include internal labor, governance, opportunity cost, and post-launch support. A practical guide to calculating return on investment can help standardize that discussion.
For operational context, examples of factory process AI examples can help teams identify benefits such as throughput, quality, and process consistency before translating them into a financial model. The same principle applies to CRM, recruitment, and service workflows. Start with the process change, then value the outcome.
Confronting Forecast Bias with Sensitivity Analysis
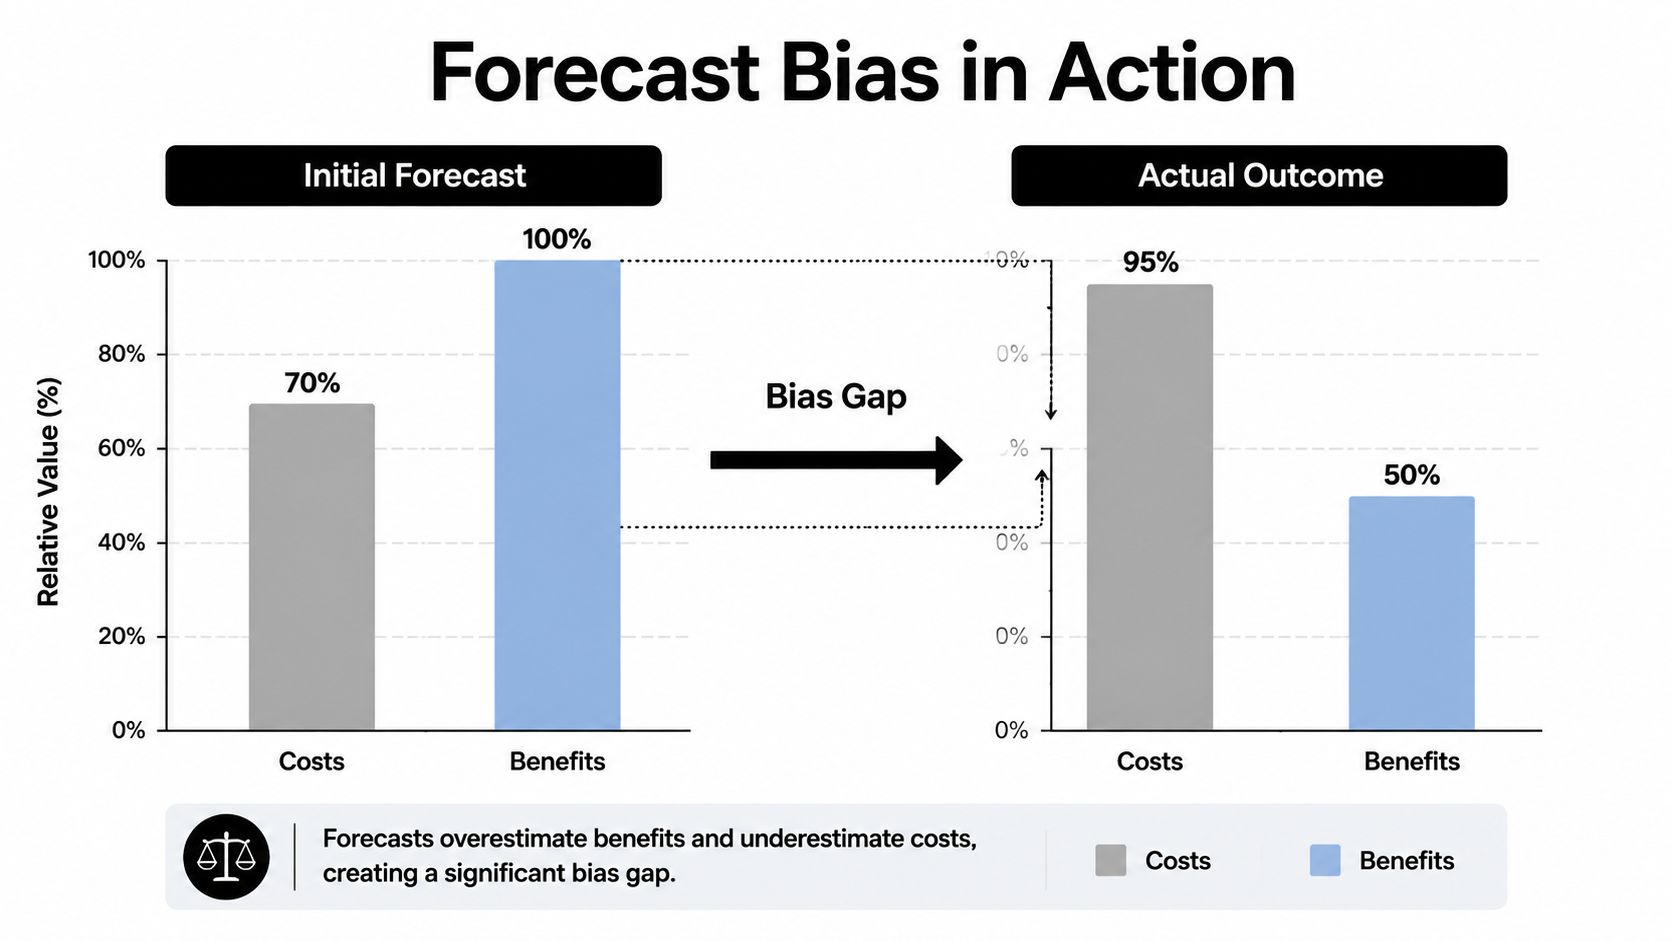
The most serious CBA error is often systematic, not computational. A peer-reviewed analysis in the Journal of Benefit-Cost Analysis found that conventional ex-ante benefit-cost ratios in public capital investment were overstated by roughly 50% to 200%, with cost underestimation and benefit overestimation both statistically significant, as reported in this analysis of the cost-benefit fallacy.
AI business cases have similar exposure. Teams forecast full adoption, steady performance, and immediate savings even though implementation introduces friction. The result looks analytical because the spreadsheet contains many rows. More rows don't correct a weak assumption.
Find the assumptions that control the output
Don't test every cell equally. Identify the variables that can change the recommendation:
- Adoption: What share of eligible work will move through the system?
- Quality: How often will staff accept the output without rework?
- Exception load: Which cases still require human handling?
- Ramp timing: How long before the workflow reaches stable performance?
- Total ownership cost: What happens when monitoring, governance, and integration effort are included?
Run a simple scenario table first. A conservative case might assume slower adoption, higher review effort, and delayed benefits. A central case should use the most defensible evidence. An upside case can include plausible improvements, but it shouldn't become the recommendation's hidden foundation.
Use simulation when variables interact
Scenario analysis works well when leaders need a clear comparison. Monte Carlo simulation becomes more useful when several uncertain variables interact, such as adoption, error rates, exception volume, and benefit timing. Recent AI ROI guidance describes structured, scenario-based approaches that include sensitivity analysis and Monte Carlo simulation for complex automation investments in AI-driven platforms.
The output shouldn't be presented as a magical probability of success. It should show which assumptions drive the distribution and where the model has little evidence. If the range is wide, the recommendation may be to run a paid pilot that measures the dominant uncertainty rather than to approve or reject the full program.
A transparent range isn't indecision. It tells leadership what the business knows, what it doesn't know, and what evidence would resolve the gap.
Report evidence quality alongside financial results. Mark estimates as observed, benchmarked, inferred, or speculative. Separate downside risks that can be mitigated through design from risks that remain outside the team's control. A polished single number is easy to repeat, but a confidence map is easier to govern.
Presenting Your Analysis and Making the Decision
Leadership doesn't need the same view of the model. The CFO usually needs NPV, BCR, payback, cash timing, and the assumptions that could reverse the result. An operations director needs implementation ownership, workflow disruption, exception handling, and monitoring effort. A board needs the recommendation, strategic rationale, downside exposure, and confidence level around the major claims.
Present the decision in layers:
- Recommendation: Proceed, pilot, defer, redesign, or stop.
- Economics: Show the selected metrics and the time profile of costs and benefits.
- Evidence: Identify which inputs come from internal data and which remain assumptions.
- Controls: State the pilot gates, monitoring owner, and conditions for continuation.
- Exit rule: Define what evidence would cause the team to stop funding the initiative.
A paid pilot is appropriate when one or two unknowns dominate the model and can be measured in production. It isn't appropriate when the workflow lacks a clear owner, the baseline is missing, or the proposed system can't be evaluated against a stable process. In recruitment, for example, comparing retained vs contingency recruiters can clarify where automation may support process capacity, but it doesn't replace a role-specific assessment of quality, judgment, and accountability.
During the pilot, track the assumptions that matter, not vanity activity. Measure actual adoption, completion quality, exception volume, review time, process throughput, and incremental operating cost. Update the model as evidence arrives, and stop the project when it misses a pre-agreed threshold without a credible corrective action.
Before presenting a business case development framework, verify that the baseline is documented, alternatives are comparable, costs include ownership and exit work, benefits aren't double-counted, uncertainty is visible, and decision gates are explicit. The analysis is ready when leadership can see both the opportunity and the conditions under which the opportunity disappears.
MakeAutomation helps B2B and SaaS teams evaluate and implement AI automation, including CRM workflows, lead generation, recruitment operations, and Voice AI agents. If your business case is being held together by untested assumptions, visit MakeAutomation to turn the model into a measured workflow with clear ownership, evidence, and decision gates.